Voice of the Customer for Vulnerability Assessment
11 July 2025 - ID G00809922 - 6 min read
By Peer Community Contributor
Vulnerability assessment solutions identify and mitigate enterprise risks by evaluating, prioritizing and addressing security vulnerabilities. This note guides security operations leaders to learn from ratings and reviews by their peers shared on Gartner Peer Insights.
To view the Interactive Voice of the Customer for this market, click the Launch button at the top of this page.
What Is Vulnerability Assessment?
Vulnerability assessment (VA) solutions identify, categorize and prioritize vulnerabilities as well as orchestrate their remediation or mitigation. Their primary focus is vulnerability and security configuration assessments for enterprise risk identification and reduction, and reporting against various compliance standards. VA can be delivered via on-premises, hosted and cloud-based solutions, and it may use appliances and agents.
Core capabilities include:
- Discovery, identification and reporting on device, OS, software vulnerabilities and configuration against security-related criteria
- Establishing a baseline for systems, applications and databases to identify and track changes in state
- Reporting options for compliance, control frameworks and multiple roles
Standard capabilities include:
- Pragmatic remediation prioritization with the ability to correlate vulnerability severity, asset context and threat context that then presents a better picture of true risk for your specific environment
- Guidance for remediating and configuring compensating controls
- Management of scanner instances, agents and gateways
- Direct integration with, or API access to, asset management tools, workflow management tools and patch management tools
What Is Gartner Peer Insights “Voice of the Customer”?
“Voice of the Customer” is a document that synthesizes Gartner Peer Insights reviews into insights for buyers of technology and services. This aggregated peer perspective, along with the individual detailed reviews, is complementary to Gartner expert research and can play a key role in your buying process. Peers are verified reviewers of a technology product or service, who not only rate the offering, but also provide valuable feedback to consider before making a purchase decision.
Figure 1 shows all “Voice of the Customer” eligible vendors in the market categorized into four quadrants based on scores assigned for User Interest and Adoption (x-axis), and Overall Experience (y-axis). The midpoint of each axis, labeled “market average,” represents the average score as calculated exclusively from vendors included in the document.
Vendors’ User Interest and Adoption (x-axis) scores incorporate three factors: review volume, user willingness to recommend, and review market coverage across industry, company size and region. Vendors’ Overall Experience (y-axis) is a composite score that incorporates average user ratings for “Overall Experience,” “Capabilities” and “Support/Delivery.” See the Methodology section for more detail.
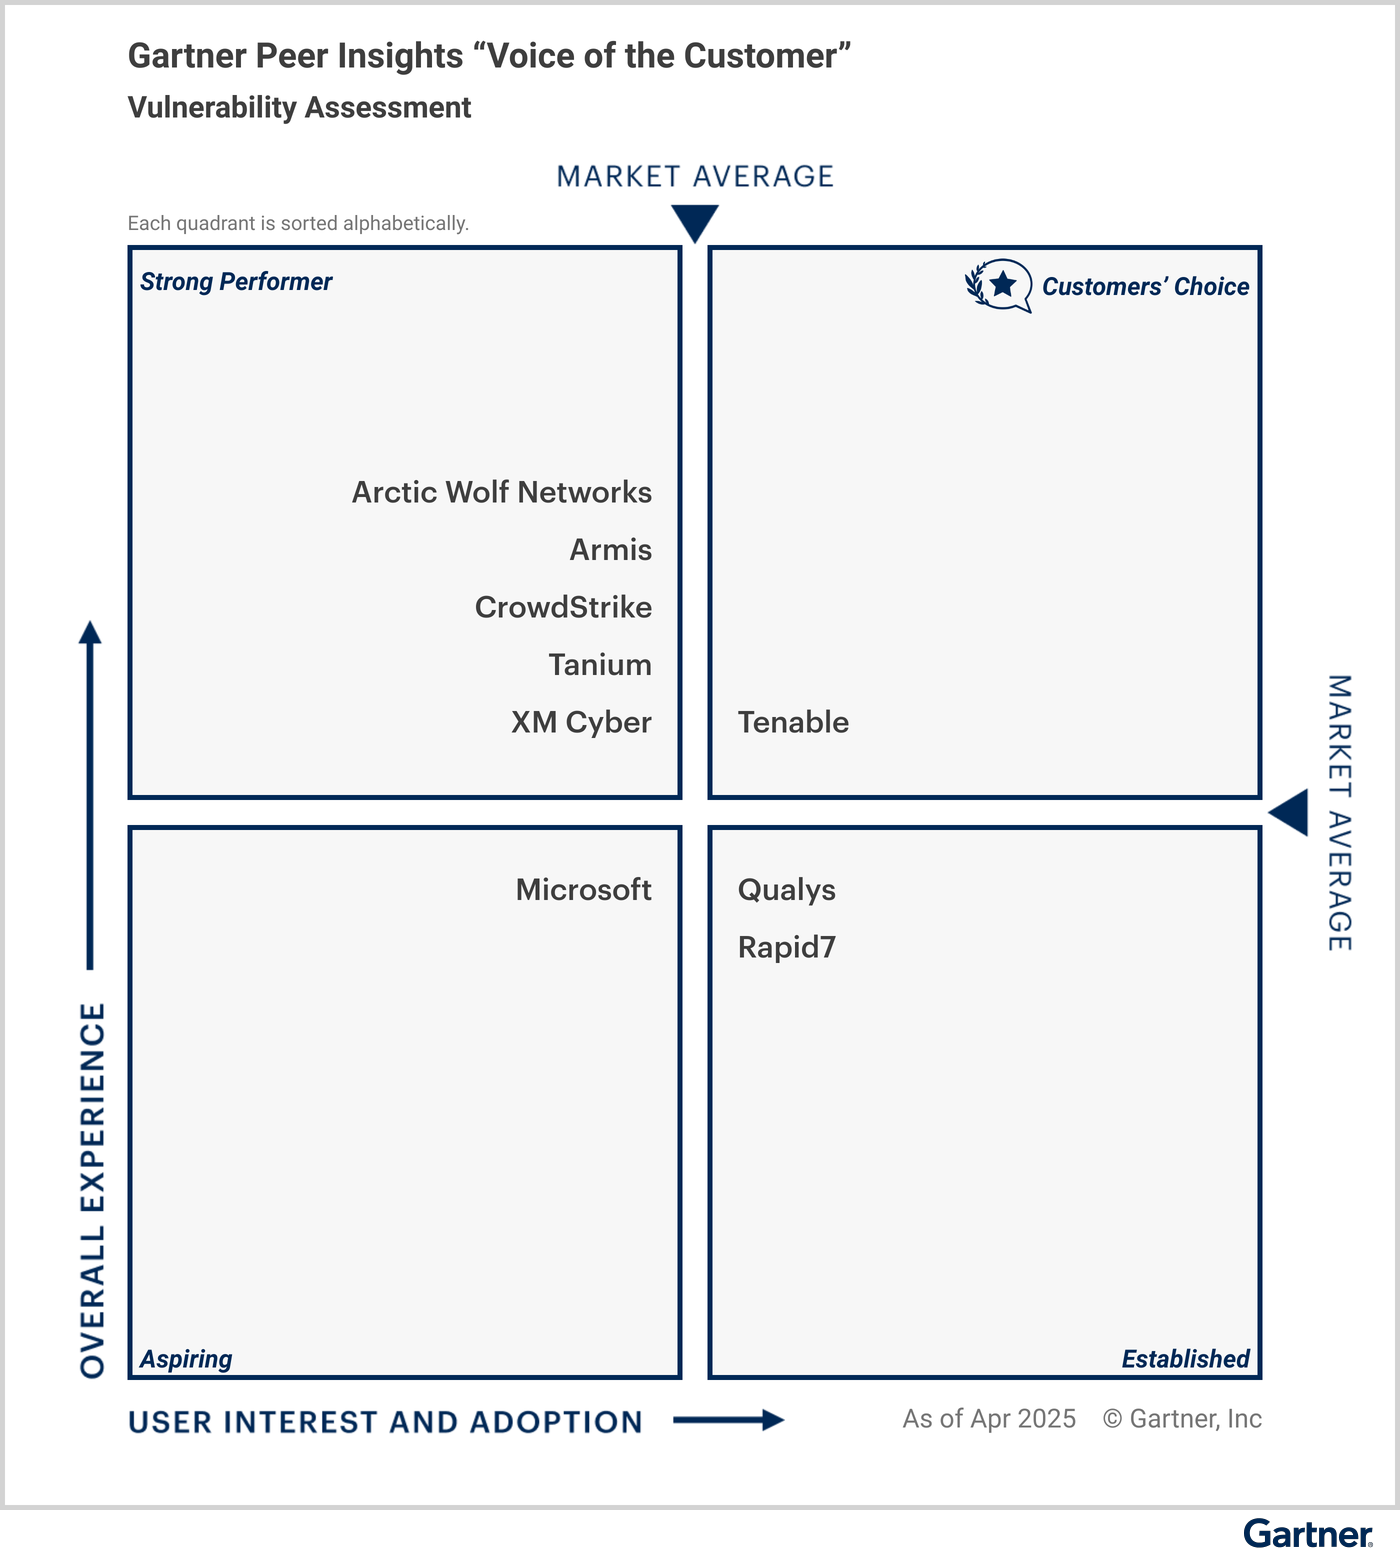
Vendors placed in the upper-right “Customers’ Choice” quadrant of the “Voice of the Customer” have scores that meet or exceed the market average for both axes (User Interest and Adoption, and Overall Experience).
Vendors placed in the lower-right “Established” quadrant have scores that meet or exceed the market average for User Interest and Adoption, but are below the market average for Overall Experience.
Vendors placed in the upper-left “Strong Performer” quadrant have scores that meet or exceed the market average for Overall Experience, but are below the market average for User Interest and Adoption.
Vendors placed in the lower-left “Aspiring” quadrant have scores below the market average for both User Interest and Adoption, and Overall Experience.
Vulnerability Assessment Peer Reviews and Ratings
In addition to the synthesis provided by the “Voice of the Customer,” you can read individual reviews and ratings on the Gartner Peer Insights page for this market.
The rest of this document highlights some key insights for the vulnerability assessment market based on 18 months of reviews and also points you to particular ways to use the site in your buying process.
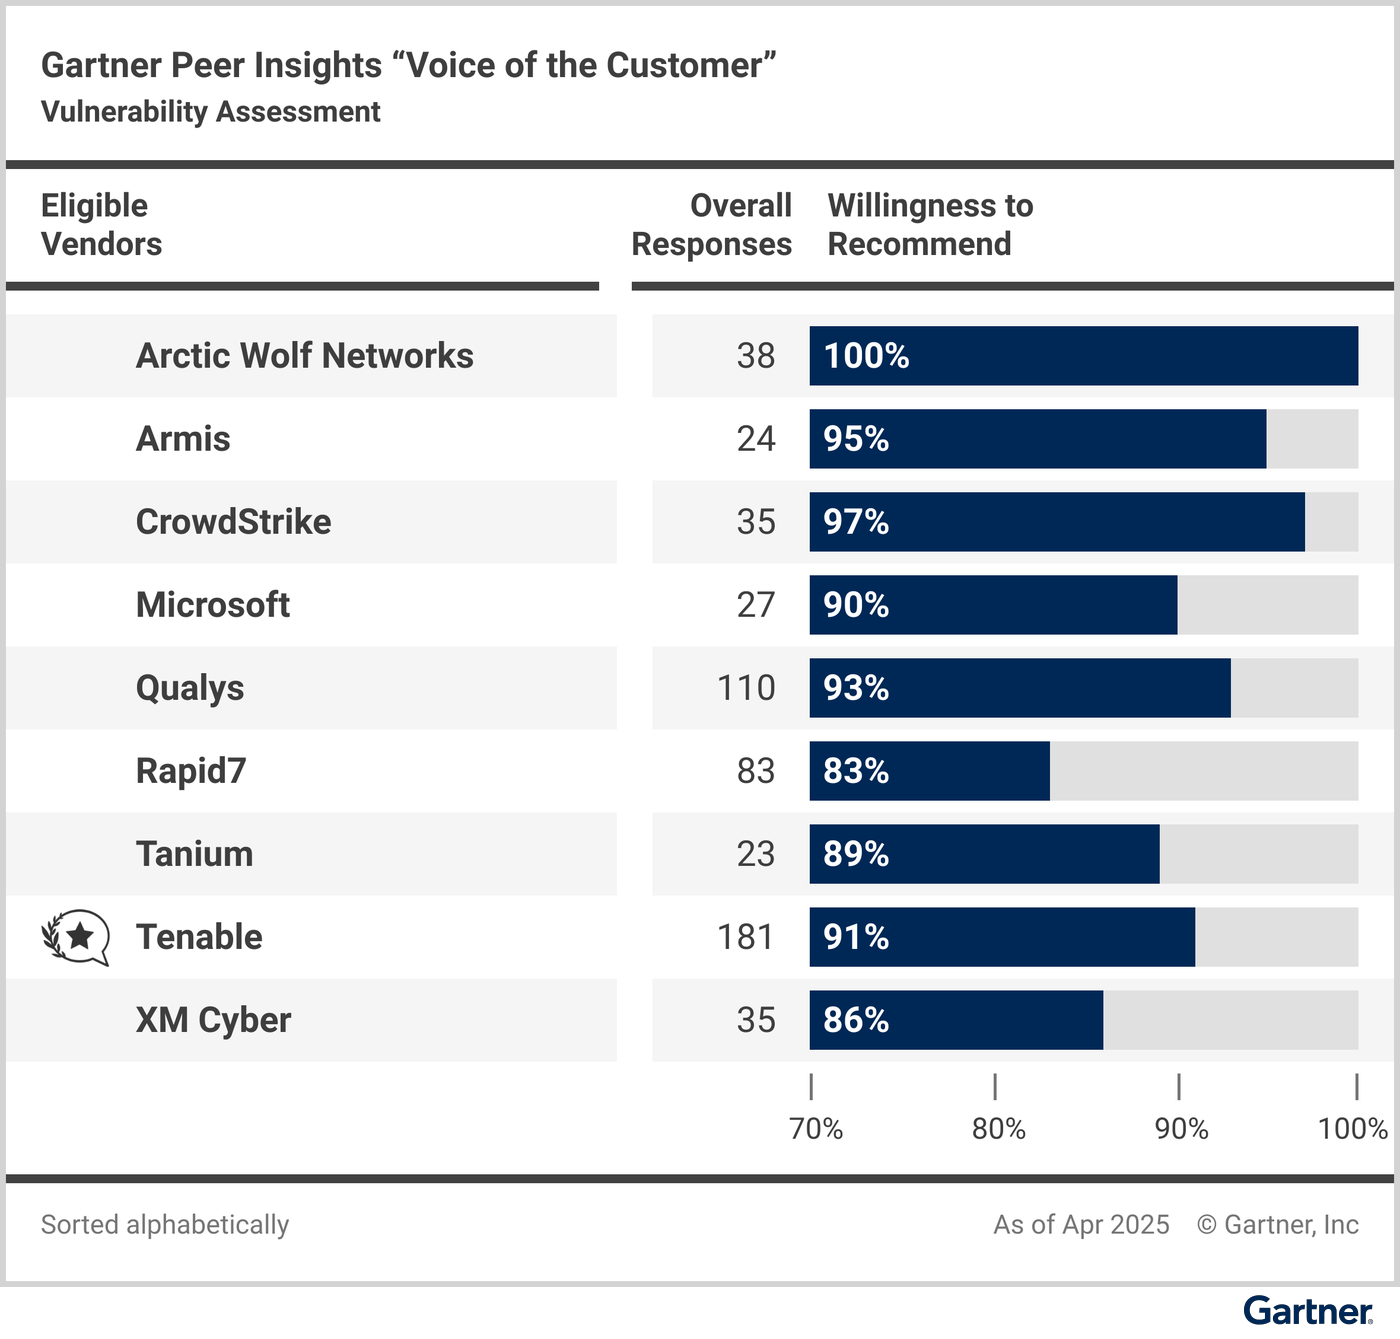
Gartner Peer Insights’ reviews give insight into end users’ willingness to recommend each vendor. Willingness to recommend is a component of the “Voice of the Customer” x-axis. For details, see Gartner Peer Insights Voice of the Customer Methodology. Figure 2 compares vendors by the percent of reviewers who were willing to recommend them (see the Methodology section for details). To create a more detailed comparison between several vendors on your shortlist, please go to the Gartner Peer Insights page for this market and press the “Compare Alternatives” button under the vendor/product you are interested in.
Vendor Summaries
Figures 3 through 11 summarize key information for each vendor included in the “Voice of the Customer”:
- Reviewer demographics for reviews received in the 18-month review period, ending 30 April 2025
- Overall Rating and rating distribution
- Other ratings covering specific aspects of the experience with the vendor
The same eligibility requirements and weighting used in the “Voice of the Customer” quadrants also apply for ratings in the vendor summary figures, including overall star rating, willingness to recommend and rating by category (see Gartner Peer Insights Voice of the Customer Methodology for details). Below each image is a direct link to the user reviews on the Peer Insights site.
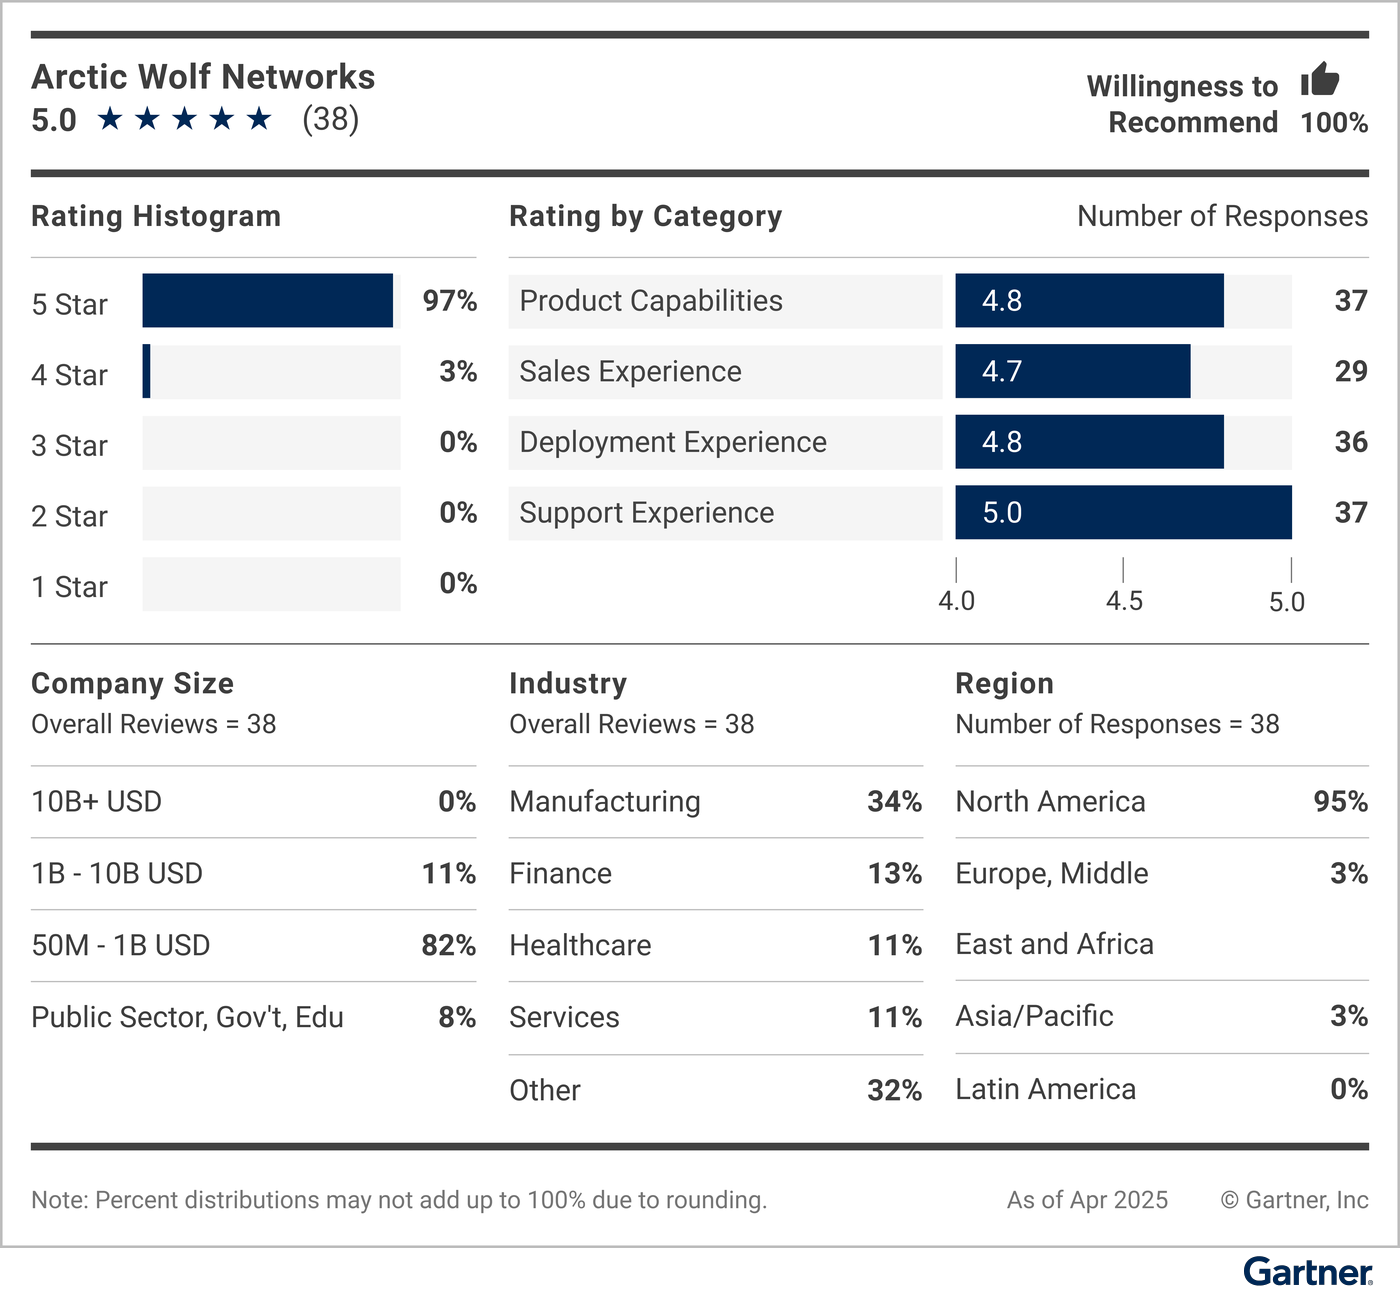
Read all Peer Insights user reviews for Arctic Wolf Networks.

Read all Peer Insights user reviews for Armis.
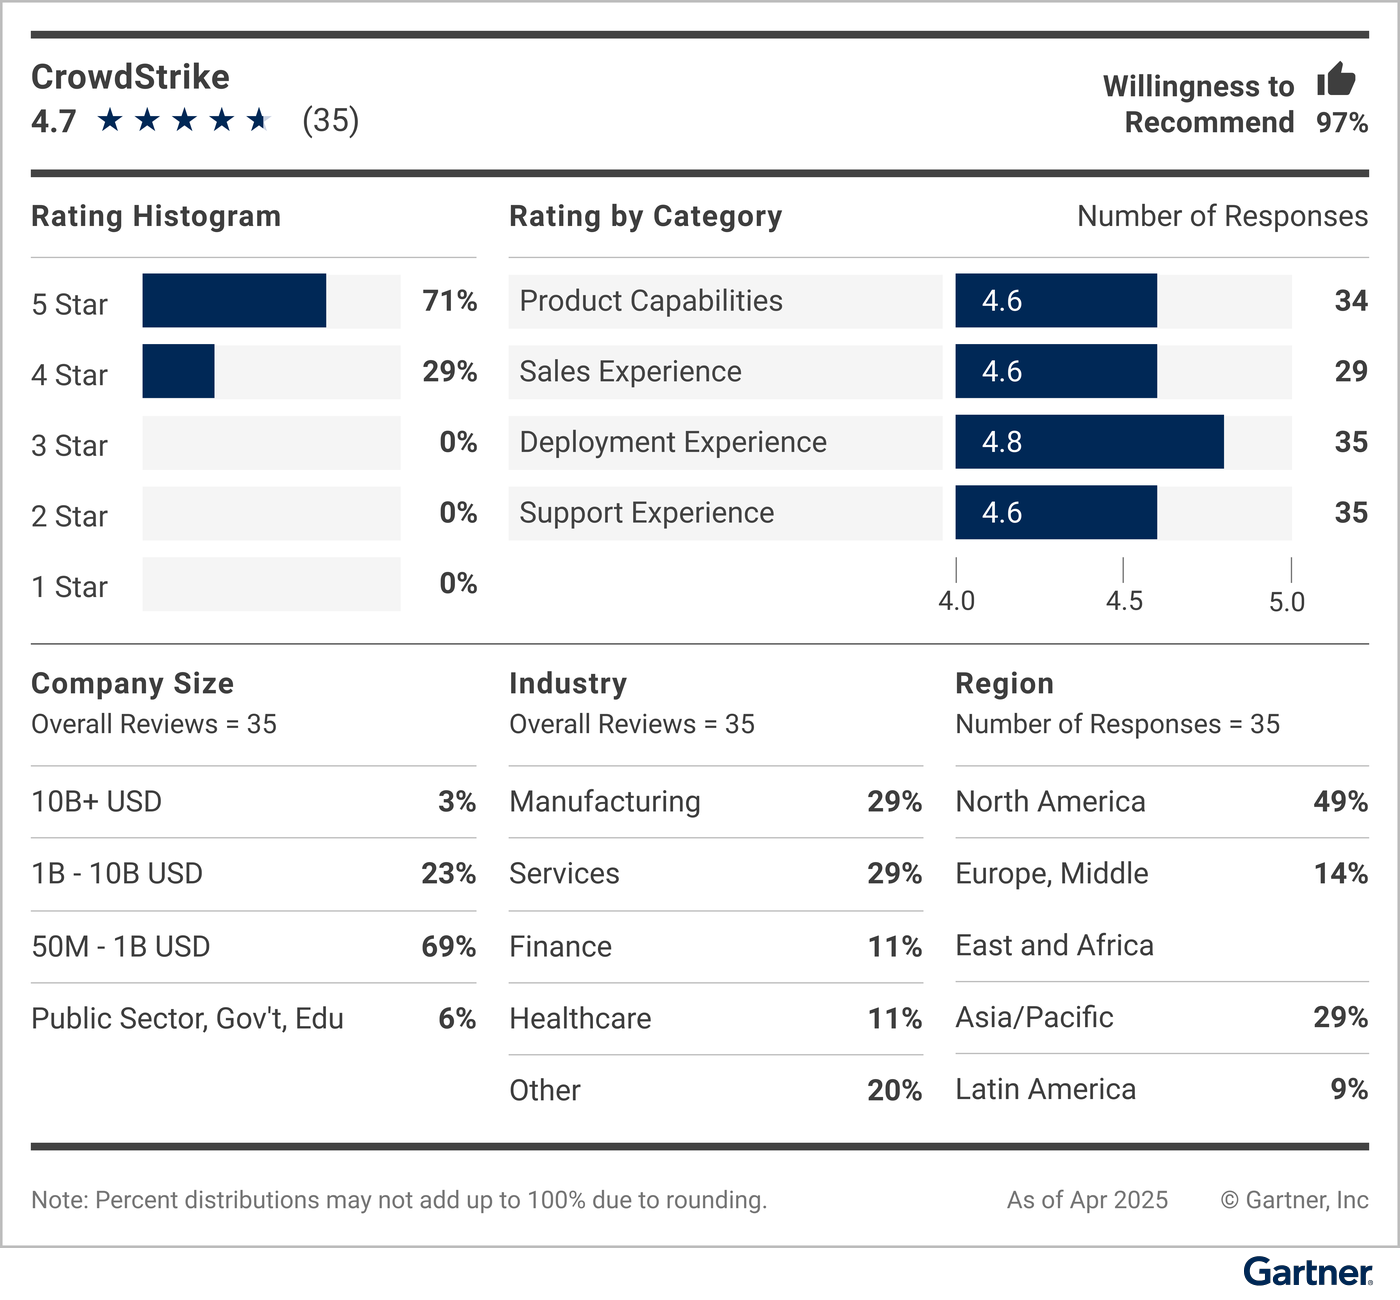
Read all Peer Insights user reviews for CrowdStrike.

Read all Peer Insights user reviews for Microsoft.
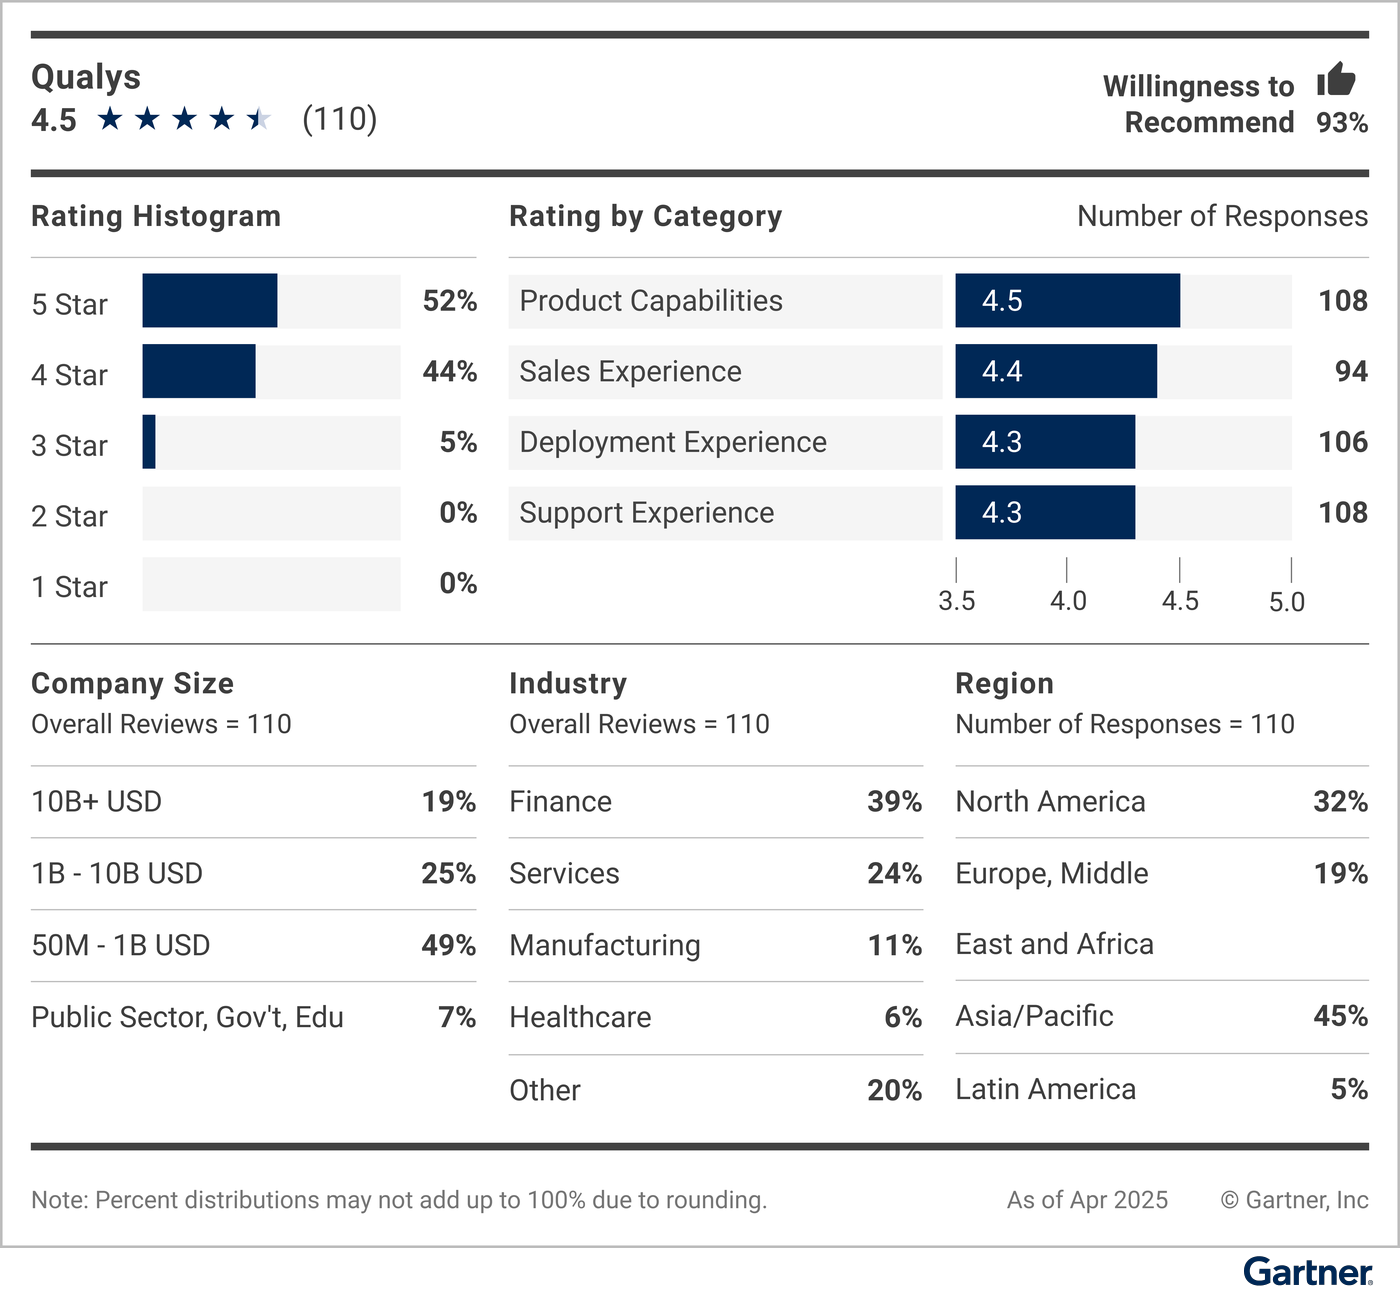
Read all Peer Insights user reviews for Qualys.

Read all Peer Insights user reviews for Rapid7.

Read all Peer Insights user reviews for Tanium.
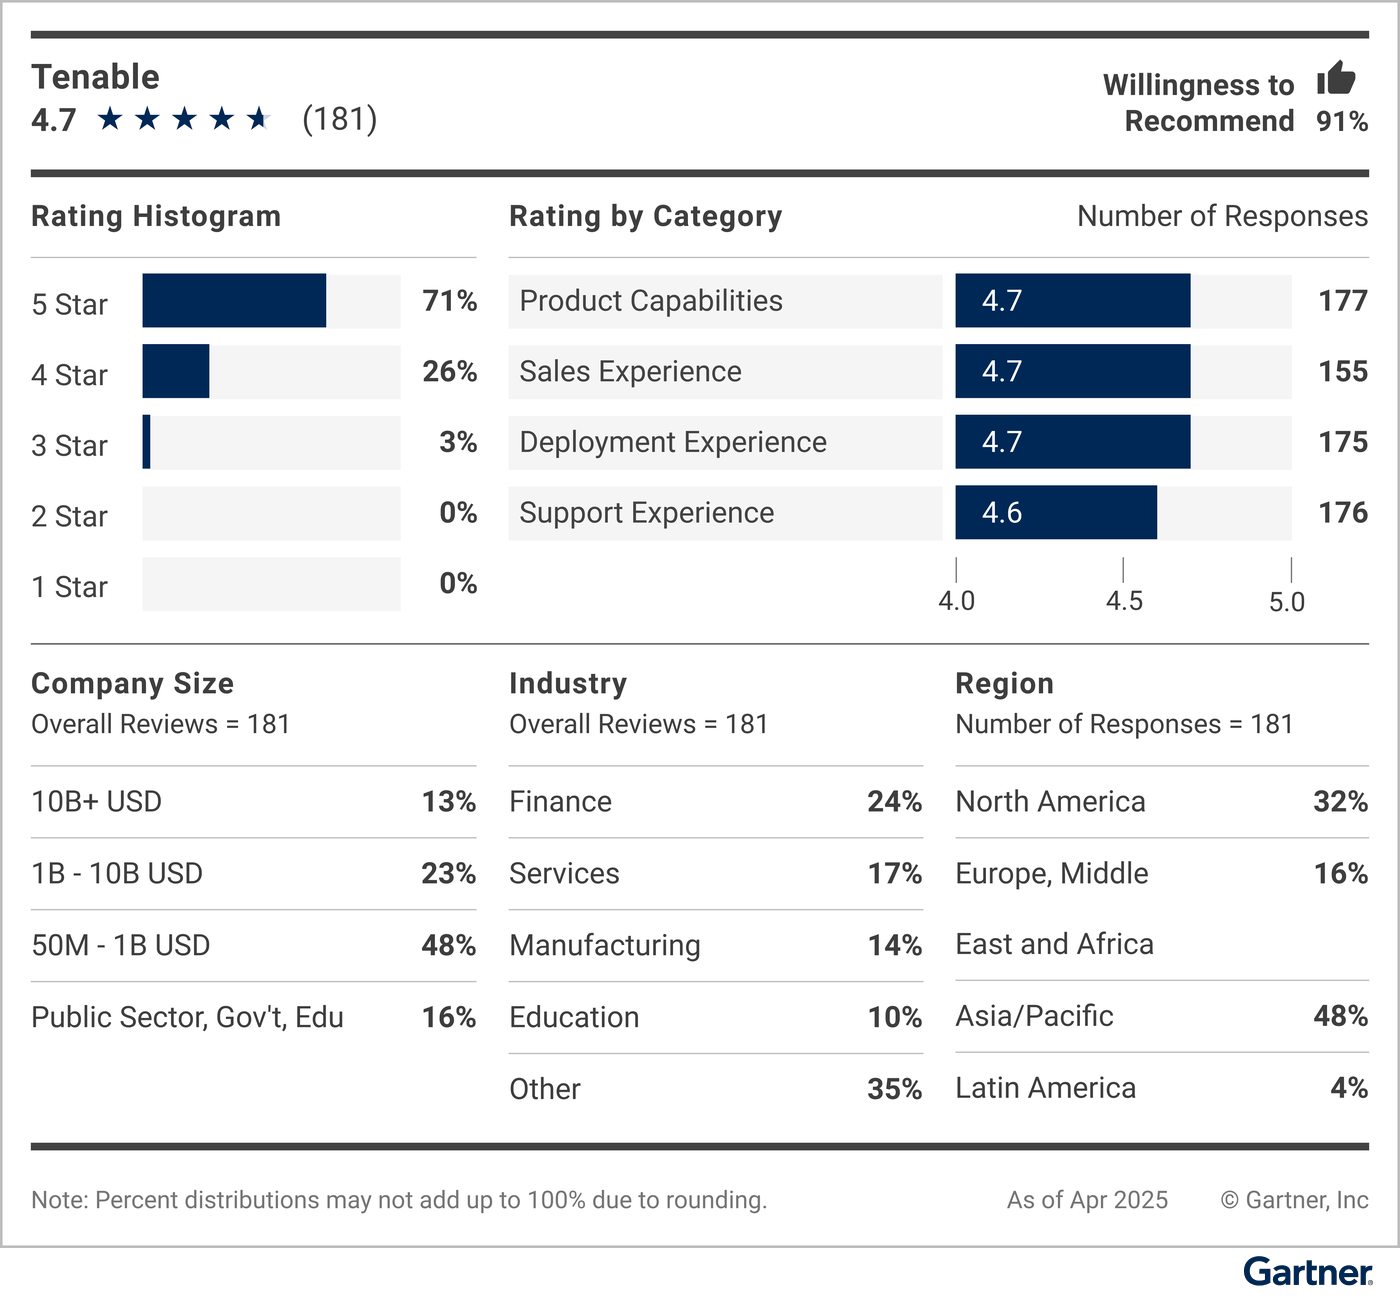
Read all Peer Insights user reviews for Tenable.

Read all Peer Insights user reviews for XM Cyber.
Methodology
A full description of the methodology can be found on the Gartner Peer Insights Voice of the Customer Methodology page.
Voice of the Customer includes vendors with products aligned to the market that have 20 or more eligible published reviews (and 15 or more ratings for “Capabilities” and “Support/Delivery”) during the 18-month consideration period ending 30 April 2025. Reviews from vendor partners or companies with less than $50 million in revenue are excluded.
In the vulnerability assessment market, Gartner Peer Insights published 1,090 reviews and ratings during the consideration period. For details, see Gartner Peer Insights Voice of the Customer Methodology.
The data used in this report is drawn from reviews on Peer Insights, a free peer review and ratings platform that regularly publishes new reviews. The “Voice of the Customer” methodology uses a snapshot of reviews data from a defined timeframe and does not automatically update as new reviews are published. The external Peer Insights site will always have the most updated peer view of the vendors and products in this report.
The numerical ratings scores in each vendor summary graphic (shown as “Rating by Category”) are best interpreted as sample statistics with a reasonable margin for error and not as exact values.