How to Build Knowledge Graphs That Enable AI-Driven Enterprise Applications
22 May 2025 - ID G00768041 - 14 min read
By Afraz Jaffri
Knowledge graphs deliver semantically enabled data management to power a diverse range of AI applications. To successfully build knowledge graphs at an enterprise level, data and analytics leaders must take an agile approach to knowledge graph development.
Overview
Key Findings
- Data and analytics leaders fail to get stakeholder buy-in for knowledge graph initiatives because they form business cases solely on the basis of connecting data silos, without addressing the opportunities for delivering AI applications.
- The flexible, composable and open nature of knowledge-graph-based data delivery eases the challenge of ensuring the semantic consistency of data across the enterprise. This allows business users, software engineers and data scientists to find, understand and use the data they need.
- Knowledge graphs can function as a stand-alone AI asset — or be used in conjunction with machine learning models in a composite AI approach — to deliver knowledge discovery, search and retrieval, recommendation, and decision intelligence platforms.
Recommendations
Data and analytics leaders and software engineering leaders looking to deploy AI in the enterprise should:
- Target a set of AI use cases where knowledge graphs can be utilized by examining the business needs in up to three functional areas, with focus on discovery, search and recommendation.
- Decrease time to value for knowledge graph development by taking an agile approach, reusing industry standard ontologies, and adapting with minimum viable ontologies and minimum viable graphs.
- Increase adoption of knowledge graphs to a range of personas by creating a set of knowledge-graph-based services and integrations.
Introduction
Leading technology companies, public sector organizations and targeted financial solutions providers are actively building and incrementally improving knowledge graphs using graph technologies to enhance data search, retrieval and recommendations. Now, more industries and even smaller organizations can take advantage of the expanding skill base to surge past their competitors. A resurgence in adjacent fields of AI (such as deep learning) has also increased interest in graph techniques, and specifically knowledge graphs, that are now filtering through to the enterprise.
Knowledge graphs also have the potential to solve many data integration challenges, which are still a significant barrier to mass AI adoption. The 2023 AI in the Enterprise Survey found that 79% of respondents classed as being a mature AI organization were effective at data integration as compared with 66% of other organizations.1 Knowledge graphs enable a fluid data environment through the use of uniform identifiers, flexible schemas and triples instead of tables.
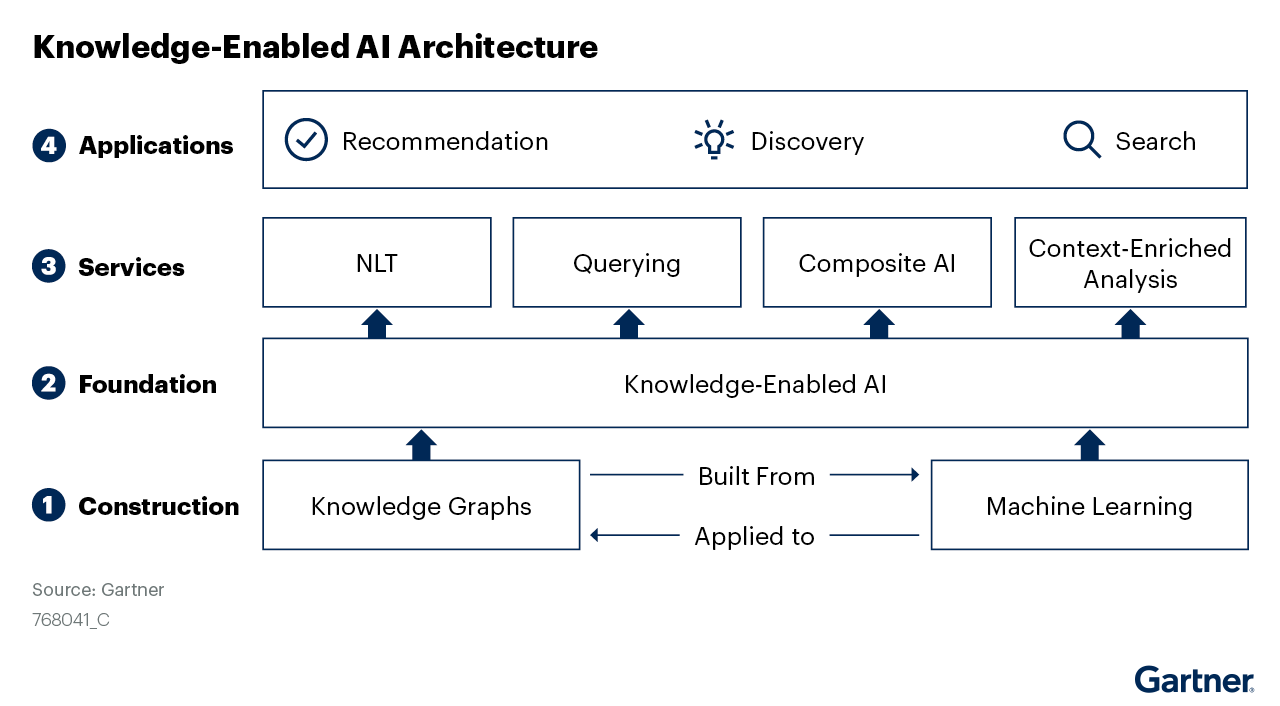
Combining the ability to define, organize and deliver data effectively with exposure of relationships and context as usable assets means that knowledge graphs and machine learning can be used together to create a foundational layer for knowledge-enabled AI, as shown in Figure 1.
This research provides data and analytics leaders with best practices to follow when initiating knowledge graph projects from a business-driven perspective to create knowledge-enabled AI applications. It also provides knowledge engineers with a method to move from proofs of concept (POCs) to real-world applications.
Analysis
Start With Knowledge Graphs That Enable Targeted Use Cases
As with any data science, analytics or AI initiative, it is critical to find the right use case before starting a project. For machine learning in particular, this is still a struggle for many organizations, but increased awareness and well-publicized use cases have helped with identification and prioritization (see AI Zodiac: Mapping AI Use Cases to Techniques).
Knowledge graphs — while familiar to data architects and knowledge practitioners — are just beginning to enter the thoughts of data and analytics leaders. And finding the right use case can be difficult.
There are a series of misconceptions about knowledge graphs — beginning with the assumption that they are a solution by themselves. In fact, knowledge graphs provide significant acceleration to data utilization approaches, but they must be assembled and populated with metadata first.
Frequently, knowledge graph initiatives start with a value proposition. The organization will be able to join up enterprisewide data that exists in silos, providing a platform for building applications that harness the inherent linkages and context that exist within a graph. However, many organizations do not have the willingness or business buy-in to invest in such initiatives because the benefits to the business remain unclear and because those that previously tried found little automation to accelerate the process.
Targeted Subgraphs Are Manageable Starting Points
Three of the most popular applications for knowledge graphs are semantic search/question-answering, knowledge discovery and recommendation engines. Decision intelligence platforms incorporate aspects from all three systems to provide an environment to describe, simulate and evaluate decision models (see Video: How Decision Intelligence Improves Business Outcomes) and are likely to become the most popular knowledge-graph-driven application.
Data and analytics leaders need to collaborate with software engineering leaders and business leaders to identify and select a domain or subdomain that has a well-defined set of data and a portfolio of use cases that will deliver impact. The job of the D&A leader is to weave a knowledge graph narrative into the implementation plan as a way of reducing technical debt and unlocking further potential use cases that are difficult to implement with singular AI techniques. This is especially true in use cases that have a natural language technology (NLT) component.
Examples of high-impact use cases include:
- Using service reports to determine the causes of failure in parts and assets
- Finding prospects with particular interests aligned with new products
- Generating complete 360-degree views of people and companies
- Matching skills to people, projects and learning materials and providing personalized journeys
- Finding regulations relating to specific contracts and investments
- Answering any question about any product
To gain inspiration, successful knowledge graph implementations that are used in the industry should be reviewed. Those that target customer or employee experience are especially suited for educating the business on the benefits of knowledge graph implementations.
Application No. 1: Semantic Search
The familiar infobox Google presents when searching for information is an output from its graph. From an internal perspective, and an external perspective, enhancing the search capability of an organization with a knowledge graph provides the ability to execute complex queries that refer to knowledge in multiple documents or sources using the relationships defined in the graph.
Example queries include:
- What regulations apply to a particular ingredient across different countries?
- What are the most common causes of failure in a particular piece of equipment, and how long does it take to replace them?
- What coats are waterproof and warm and can be packed in a suitcase?
Knowledge graphs also enable domain experts to define business rules that are incorporated into the data model and enable software engineers to build expert systems using the combination of rules and data.
Application No. 2: Knowledge Discovery
Knowledge discovery is an application of a knowledge graph to discover previously unknown or hidden information. For example, modeling entities and relationships in a graph structure and with operational semantics can uncover:
- Potential treatment pathways for patients
- New materials that are more cost-effective in production for manufacturers
- Fraudulent companies committing tax evasion for law enforcement
Knowledge discovery applications can utilize two powerful properties of the graph data model: analytics and logic-based reasoning. Graph analytics refers to the set of techniques that compute various properties of the graph structure, as described in 3 Ways to Enhance AI With Graph Analytics and Machine Learning. Reasoning refers to the ability to infer new triples or facts of information from the graph using a set of rules, usually defined in an ontology. Reasoning engines can infer hierarchical relationships, inverse and transient properties, and other facts from the graph.
The combination of graph analytics, machine learning and reasoning is an example of composite AI leading to more robust AI systems than those that use only one technique.
Application No. 3: Recommendation Engines
Recommendation services are now a familiar component of many online stores, personal assistants and digital platforms. The technology has been commoditized to a large extent so that many e-commerce platforms, insight engines and analytics tools include some form of recommendation engine.
For more complex scenarios — such as in-issue resolution, medical diagnosis or applicable legal rulings — a graph-based solution is more suitable to finely tune the prediction algorithm. In such cases, the recommendations need to take a content-based approach rather than using collaborative filtering, which is mostly used in digital commerce. Utilizing the relationships between entities in a knowledge graph and mapping a path between entities can allow for recommendations to be made based on their position in the graph.
The usage of graphs in these domains and subdomains brings benefits in itself, but the real power of graphs is realized when they can be joined across domains to form an enterprise knowledge graph. The enterprise knowledge graph can then be used for applications such as a data fabric and digital twins, where business processes and decisions are replicated in a virtual environment.
Decrease the Time-to-Value Cycle by Using Agile for Ontology and Knowledge Graph Development
Many organizations seek to define an enterprisewide schema, ontology or taxonomy first. This is a mistake. Such endeavors are costly, time-consuming, filled with disagreement and, in many cases, stopped before any value can be shown or delivered. A knowledge graph continuously evolves. For this reason, agile practices are particularly useful when developing knowledge graphs.
The combination of three best practices for building knowledge graphs will lead to faster and more impactful results:
- Use existing standards, schemas and ontologies as starting points.
- Extract a list of key terms that need to be modeled using data mining/entity extraction/data profiling tools.
- Add handcrafted rules, entity attributes and relationships from business glossaries and data dictionaries.
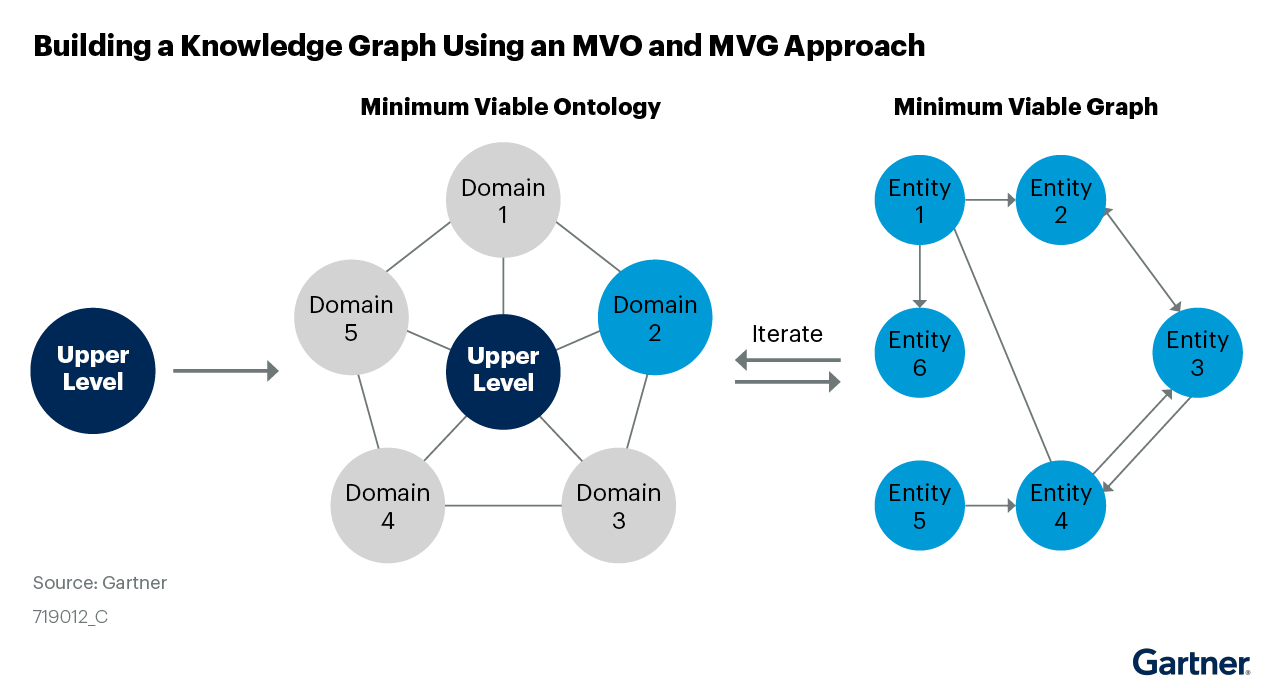
The concept of a minimum viable product can be transferred to knowledge graph development by thinking in terms of the minimum viable graph (MVG) and minimum viable ontology (MVO). This means that only as many concepts and relationships will be defined (the ontology) as is needed to deliver some defined capability, corresponding to the instance data in the graph. Existing ontologies that are open and freely available — such as Dublin Core for publishing, SKOS for taxonomies and FIBO for financial contracts — should be reused where applicable. The process is depicted in Figure 2.
Composing an ontology in this modular fashion, while utilizing agile practices, will provide a flexible and dynamic way to achieve enterprise standardization. Once this MVO is developed, it will be tested against the use case being delivered and also against any existing graphs. Instance data can then be populated against the MVO to create an MVG that can be expanded iteratively as more concepts are needed and defined. Using this method, it is possible to start small but scale quickly while delivering value.
Agile practices support an evolving ontology process, allowing knowledge graphs to deliver value even as they are being developed.
Support a Minimum Viable Graph Approach Using Machine Learning Techniques
Once an MVO has been developed, it will need to be tested and used by populating a graph of instance data based on the ontology. The tendency with this task is to also try to gather as large a dataset as possible and perform a batch conversion of structured data based on mapping between existing relational schemas and an ontology. This should be avoided because the process is still prone to the same issues that occur with spending too much time in upfront design. A knowledge graph development project should ensure that the agile practices of “interactive” and “incremental” are adhered to.
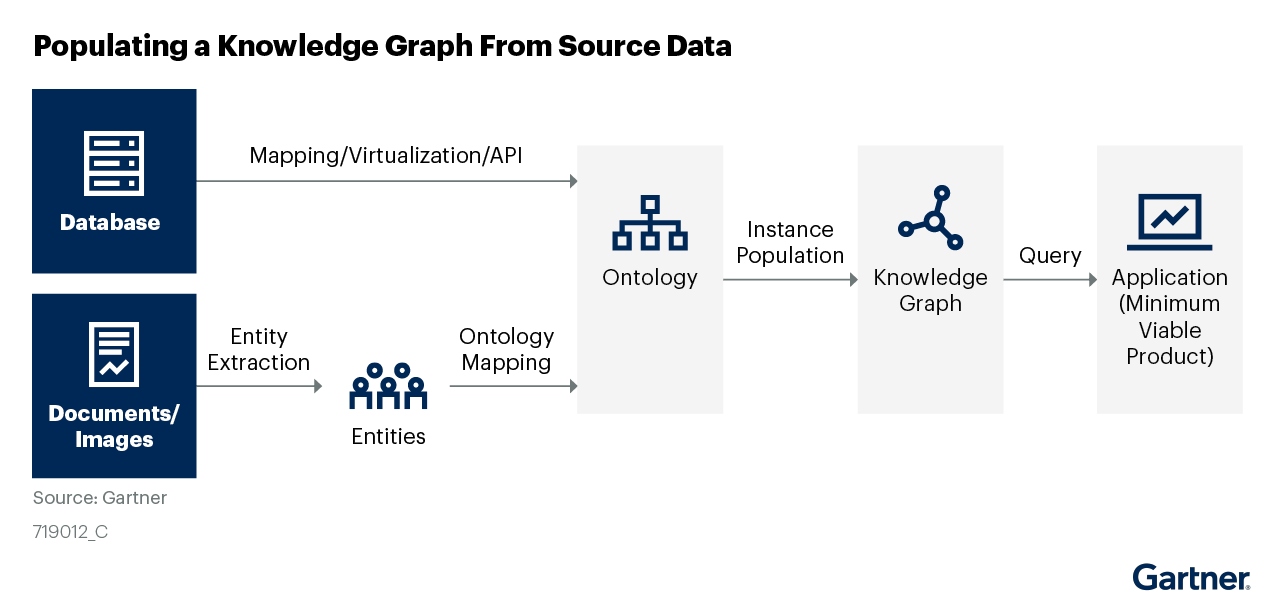
Performing an analysis of the data held within repositories — both structured and unstructured — has become substantially easier with the introduction of generative AI models that can be used to quickly create a baseline set of entities, relationships and even full ontologies from documents or pieces of text. For more information on these approaches, see AI Design Patterns for Knowledge Graphs and Generative AI. Data catalogs can also help in automating the process of discovering, inventorying, profiling, tagging and creating semantic relationships between distributed and siloed data assets.Other options for constructing a graph from relational databases include:
- Adding a virtual query layer so that graph queries can be converted to SQL and performed on relational databases
- Performing extraction, transformation and loading (ETL)/extraction, loading and transformation (ELT) processes from source systems into a graph database
- Modeling relational tables as a graph and querying in SQL
There are several open-source and off-the-shelf tools that can be used for automated and semiautomated entity recognition and extraction from text and documents. Generic or custom models extract a base set of concepts, which can then be mapped against an ontology and included in a knowledge graph, as shown in Figure 3.
Maximize Knowledge Graph Utilization Through Multiple Channels
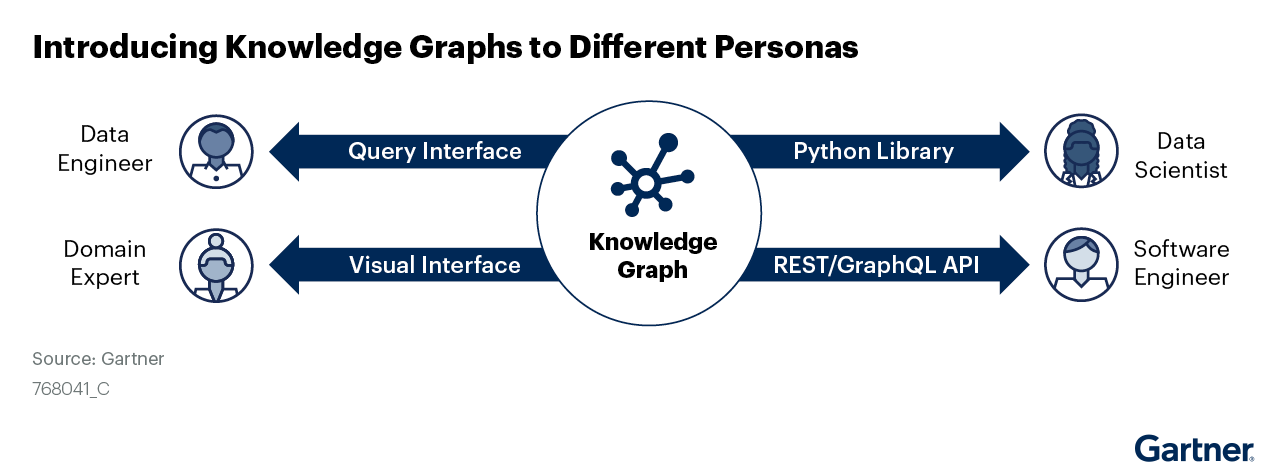
Knowledge graph development must be a collaborative process between business units and IT. Domain experts will be required to give their insights into the entities and relations that form an ontology. Data scientists will look at how the ontology can be realized with the data available, and IT will need to ensure the platform on which a knowledge graph is built is robust and scalable. Software engineers will utilize the knowledge graph to fill the data needs of data-intensive applications. For each one of these personas, the graph will need to be exposed in different ways, as shown in Figure 4.
The integration of generative AI-based assistants in many graph platforms has accelerated the time to reach value and gain actionable insights from graph data. Analytics and AI leaders who previously may have been averse to using the technology should now reconsider and leverage the enhanced usability features.
For downstream utilization, knowledge-based services should be delivered as shown in Figure 1. These could include entity look-up and reconciliation, 360-degree views, entity history and multihop traversal. In addition, GraphQL provides a declarative way to describe the data that is needed without the need to understand source system schemas, and its interface is easily constructed from an underlying knowledge graph.
Create a Graph Modeling Mindset by Focusing on Case Studies
Knowledge graphs range in complexity and can have a steep learning curve. It can be especially difficult to change the organization’s mindset — moving from a relational and tabular way of thinking to one that focuses on graphs and relationships. This can be countered by not dwelling on the theory, standards or differences between graph types and instead focusing on examples and use cases that are publicly available. Three case studies covering different applications of knowledge graphs are described in How Graph Techniques Deliver Business Value.
Individuals from each of the user groups listed above should be selected to be evangelists and graph practitioners within their community. The functional communities should also meet regularly to share insights and best practices and to overcome any hurdles in the development process. As the knowledge graph is built out, the community will be responsible for prioritizing and selecting use cases and accelerating time to value for all data-driven enterprise applications.
1 2023 Gartner AI in the Enterprise Survey. This study was conducted to understand the keys to successful AI implementations and their impact on the broader AI that has been brought by generative AI. The research was conducted online from 19 October through 21 December 2023 among 703 respondents from organizations in the U.S., Germany and the U.K. The main sample consisted of 645 out of the 703. Organizations were required to have developed or intended to deploy at least two AI initiatives within the next three years. Respondents were required to be part of the organization’s corporate leadership or report to corporate leadership roles. Fifty-eight out of 703 are the business intelligence (BI) sample. Organizations were required to have developed or intended to deploy at least one AI initiative within the next three years. Respondents were required to be part of the organization’s corporate leadership or report to corporate leadership roles or below (senior manager and above) and to be primarily responsible for BI in their organizations. Both the main sample and the BI sample respondents were required to have a high level of involvement with at least one AI initiative, and they were required to have one of the following roles when related to AI in their organizations: determine AI business objectives, measure the value derived from AI initiatives, or manage AI initiatives development and implementation. Quotas among the main sample were established for company size and for industries to ensure a good representation across the sample. No quotas were established for the BI sample. Disclaimer: The results of this survey do not represent global findings or the market as a whole, but reflect the sentiments of the respondents and companies surveyed.