Critical Capabilities for Digital Experience Monitoring
28 October 2025 - ID G00823800 - 31 min read
By Pankaj Prasad, D.B. Cummings, and 4 more
DEM tools monitor the health and performance of applications to provide insights into end-user experience as well as business outcomes. I&O leaders can use this report to compare DEM tools by evaluating them against five critical capabilities and five use cases.
Overview
Key Findings
- Despite growing interest in leveraging AI and machine learning to drive automation, anomaly detection and advanced analytics within digital experience monitoring (DEM), practical adoption remains inconsistent and effective use cases are still emerging.
- Organizations find it difficult to unlock the full value of DEM solutions due to lack of a clear internal consensus on which metrics best represent user experience, network health and business impact, which is further compounded by underutilization of key DEM capabilities, such as synthetics and real user monitoring (RUM).
- The diverse priorities of stakeholders such as ops teams, business leaders, site reliability engineers (SREs) and network teams, all of whom find DEM relevant, make it difficult to ensure ongoing effectiveness across the business, limiting the overall impact of DEM initiatives.
Recommendations
- Optimize investment in analytics and AI for DEM by focusing on outcome-driven use cases — such as automated root cause analysis, generating actionable insights and mapping technical performance to business impact — rather than on technical AI features alone.
- Ensure your monitoring strategy addresses both traditional and emerging needs, including session replay, customer journey mapping and alignment with business outcomes, by establishing key DEM metrics, such as application performance index (Apdex), page load time, transaction success rate and error rates.
- Support the monitoring of service-level indicators (SLIs) and service-level objectives (SLOs) that reflect business-critical user journeys by engaging all relevant stakeholders in DEM and observability decisions. Highlight the specific outcomes each group values, such as user experience improvements or faster incident resolution.
What You Need to Know
Most approaches to infrastructure and application monitoring collect logs, metrics, and/or trace data to understand primarily the technology’s health and performance. In contrast, DEM tools provide visibility and analysis from the end user’s perspective. They are used when the digital experience of customers is a vital component of enterprise success.
Potential buyers for DEM tools include:
- IT operations
- Application developers
- Site reliability engineers
- Application owners
- Customer experience specialists
This Critical Capabilities report is a companion to Gartner’s Magic Quadrant for Digital Experience Monitoring. It differs from the Magic Quadrant by focusing less on overall vendor positioning in the market and more on how each tool performs against the most critical capabilities and use cases.
Gartner recommends using the interactive version of this report to adjust capabilities and weightings to reflect your unique needs. Our analysis synthesizes vendor-provided product information, generally available functionality as of June 2025, and Gartner client feedback from the past year. We recommend that I&O teams use this report in conjunction with the Magic Quadrant, inquiries with Gartner analysts and other Gartner insights to define their requirements and select the solutions that best match their needs.
Analysis
Critical Capabilities Use-Case Graphics
Vendors
Blue Triangle
Blue Triangle is a SaaS-based platform designed to capture end-user digital experiences and deliver actionable insights for website performance optimization. Its capabilities include real user monitoring, synthetic transaction monitoring, conversion rate optimization, revenue impact analysis, and comprehensive alerting and reporting features.
Blue Triangle’s highest-rated capabilities include real user monitoring and customer journey mapping. The product’s lowest rated capabilities are in synthetic transaction, mobile app and internet performance monitoring.
Blue Triangle’s highest-scored use cases were application owner and customer experience specialist, which indicates its strongest fit is for business-focused roles. Blue Triangle may not be the best fit for app development, SRE and IT operations use cases, where it trails most competitors, reflecting weaker alignment with technical and operational requirements.
Catchpoint
Catchpoint’s Internet Performance Monitoring (IPM) platform is focused on providing visibility of the internet stack to ensure a great digital experience. It offers comprehensive monitoring and performance analysis for websites, applications and networks. Its products cover synthetic transaction monitoring, real user monitoring, border gateway protocol monitoring, tracing, internet stack monitoring and endpoint monitoring. It provides deep insights into user experience and network health.
Catchpoint’s highest-rated capabilities were in internet performance monitoring, synthetic transaction monitoring (STM) and API monitoring. Notably, it was very strong in the IPM category. Its lowest rated capability was customer journey mapping, which it does not offer.
Catchpoint scored high in the IT operations and site reliability engineering use cases, highlighting its suitability as a product that is more aligned to operations. Its scores in the customer experience specialist and application owners use cases reflect the lack of customer journey mapping.
Checkly
Checkly’s DEM offering consists of Monitoring, Traces and Status Pages products, focused on synthetic monitoring of web applications and APIs. The platform uses Playwright-powered browser checks (an open-source automation framework), API monitoring and heartbeat tests to track performance and detect issues.
Checkly’s highest-rated capability was in STM an API monitoring. Checkly’s DEM rating reflects the platform’s lack of real user monitoring and session replay, as well as internet performance monitoring capabilities.
Checkly’s lowest use-case scores were for the customer experience specialist and application developer use cases, indicating it may not be the best fit for these needs.
Conviva
Conviva’s DEM offering consists of its Digital Product Insights (DPI) and Video Streaming Insights (VSI) products, which provide real-time, outcome-based performance analytics for applications, websites, streaming video, and AI agents in production environments. Conviva is available exclusively as a SaaS solution, with no on-premises deployment options.
Conviva’s highest-rated capabilities include real user monitoring and session replay, as well as customer journey mapping capabilities. Its AI Agent Performance Insights is a noteworthy product addition, as this is a rapidly evolving and emerging field. Conviva lacks a synthetic transaction monitoring capability, and this is reflected in its score in this critical capability.
The customer experience specialist use case is Conviva’s strongest. The platform’s usability is enhanced by the Nexa AI agent, which provides help information. Users can also request specific data insights, like check-out success rates or process duration, and receive actionable analysis. The lowest-scored use case was site reliability engineering.
Datadog
The Datadog platform goes beyond DEM to include observability and security features. Its DEM solution consists of Synthetic Testing & Monitoring, Real User Monitoring, Session Replay, Product Analytics, and Error Tracking.
Datadog’s platform includes a number of differentiating features that DEM users benefit from, such as Watchdog AI for automated outlier detection, dead click tracking to detect user frustration and heatmaps for behavioral analysis. Additionally, it offers incident management and on-call functions to facilitate faster incident triage and response.
Datadog’s highest ratings were in RUM and session replay, customer journey mapping, and STM and API monitoring. Its internet performance monitoring capability was its lowest rating, due to heavy reliance on manual analysis of RUM performance or STM traceroute data, presenting an opportunity for improvement. The vendor’s scores reflect strong alignment with all DEM use cases, achieving high ratings in the customer experience specialist use case and a low score in IT operations.
Dynatrace
Dynatrace’s observability platform includes DEM capabilities for RUM, session replay and synthetic monitoring. It has both a SaaS offering and a self-hosted option called Dynatrace Managed that can be deployed on customer-provisioned infrastructure. Dynatrace’s platform offers strong root-cause analysis, workflow automation, segmentation, rage click analysis and actionable recommendations.
Dynatrace’s highest capability rating was for real user monitoring and session replay capability. Its lowest capability score was in internet performance monitoring.
Dynatrace’s highest use-case score was for the customer experience specialist and application owner use cases, which was boosted by its Davis AI-led advanced analytics. Its lowest-scored use case for IT operations reflects limited internet performance monitoring capabilities.
IBM
IBM Instana Observability is designed to help organizations monitor, manage and optimize the performance of their applications and infrastructure. It provides real-time insights and automated monitoring, is offered as both a SaaS and self-hosted solution, and uses a single-agent architecture.
Instana’s highest rating is in the synthetic transaction and API monitoring capability. Instana’s Smart Alerts capability neatly integrates into the wider observability platform, ensuring that outages are quickly and easily identified. Its lowest capability score was in RUM and session replay, where the lack of session replay capabilities affected its score.
Instana scored well for the application owner use case, reflecting its strength in this area, boosted by the synthetic capabilities. Its lowest use case score was for customer experience specialist.
ip-label
ip-label’s Ekara platform provides an integrated solution for monitoring internal (intranet) and external customer-facing digital applications. It extends support to Citrix virtual environments, VDI, and thick-client desktop applications alongside API checks, web synthetic transactions, and real-device mobile monitoring. The suite also includes Ekara Green for sustainability analysis, Ekara Studio for no-code scenario creation, and Incident Guard for AI-driven alert qualification.
Ekara’s highest-rated capability was STM and API monitoring, followed by mobile app monitoring. Its lowest rating was in customer journey mapping and internet performance monitoring.
Ekara’s highest scores were in application development, site reliability engineering, and IT operations. Ekara Studio makes it a good choice for development teams, while support for virtual, desktop, and other nonbrowser environments makes it a good fit for IT operations teams that require coverage beyond browser-based workflows.
ITRS Group
ITRS Group’s Uptrends SaaS product offers synthetic monitoring, real user monitoring and API monitoring. Uptrends also integrates with ITRS Analytics, the company’s observability platform. ITRS Analytics ingests telemetry from multiple sources, including ITRS Geneos for application monitoring and ITRS Opsview for IT infrastructure and business-service monitoring, as well as cloud capacity and cost management, to deliver data-driven business insights. ITRS Analytics, Geneos, and Opsview can be deployed on-premises and on public/private cloud.
Uptrends’ highest scoring critical capability was for synthetic transaction monitoring, which reflects its capabilities for API monitoring. Its lowest capability score was for internet performance monitoring and customer journey mapping capabilities.
Uptrends is most suited to SRE and application development use cases, particularly for enterprises seeking a self-managed solution integrated into the broader ITRS offering. Its lack of features for customer journey mapping and internet performance monitoring contributes to its scores in the application owner and customer experience specialist use cases.
ManageEngine
ManageEngine’s DEM offering is Site24x7, which is delivered as a SaaS platform and focuses on full stack observability. Applications Manager and OpManager Plus are self-hosted offerings that provide application performance insights and full-stack observability, respectively.
ManageEngine’s highest score capability was for RUM and session replay capability, reflecting its ability to capture events like rage clicks, which highlight user frustration. Its lowest-rated capability was for customer journey mapping, due to the offering’s focus on session replay and troubleshooting rather than customer journeys.
While Site24x7 scored well for all use cases, it scored highest for the IT operations use case, which is aided by its zia chatbot’s user-friendly insight-capturing capability. Its lack of customer journey mapping makes it less suitable in the business context for the application owner.
New Relic
New Relic’s DEM offering is fully integrated into its Intelligent Observability Platform, a SaaS solution that combines its comprehensive DEM capabilities with APM, infrastructure, security, and log management. In the past year, the vendor added streaming video and ads intelligence, expanded mobile OS support (Flutter, .NET MAUI, watchOS), and introduced AI‐driven session summaries with natural‐language query generation.
New Relic’s highest ratings were in real user monitoring and session replay, with its lowest ratings in mobile app monitoring and IPM. Nonetheless, it rated well across all capabilities, reflecting comprehensive end-to-end visibility across web, mobile, and network interactions.
New Relic scored well across all use cases, with its highest score for customer experience specialist. This positions New Relic as a strong choice for scenarios requiring deep insight into user interactions and customer journeys, such as customer experience specialists and application owner roles. Its broad capabilities also make it a solid option for IT operations teams.
Riverbed
Riverbed Aternity is sold primarily as SaaS but is also available as a self-hosted solution, allowing clients to host the platform on-premises or in their own cloud. It is focused on digital experience monitoring across endpoints, applications, infrastructure and network. Aternity User Journey Intelligence (UJI) is a SaaS solution offered through an OEM partnership with Blue Triangle (evaluated separately in this report).
Riverbed applies causal and predictive AI for automated DEM insight surfacing, proactive alerting, benchmarking and multimetric correlation. Riverbed’s Unified Communication (UC) Module provides live, real-time predictive out-of-the-box monitoring for all major UCaaS and media streaming platforms, including Teams, Zoom, Webex, Google Meet and numerous VoIP solutions.
Riverbed’s highest critical capabilities scores reflect strong performance in the areas of customer journey mapping and mobile app tracking. The vendor’s highest use-case score was in application development. Its lowest use-case score was in IT operationsr.
SolarWinds
SolarWinds’ offering consists of the SolarWinds Observability SaaS platform, which is a full-stack observability platform that includes RUM and STM features.
SolarWinds’ highest critical capabilities ratings were for internet performance monitoring and synthetic transaction monitoring. Although users can simulate mobile device views, the lack of customer journey mapping and mobile app monitoring is reflected in the product’s lowest rating for these capabilities.
The lack of customer journey mapping and mobile app monitoring contributes to its scores for the application owner and customer experience specialist use cases. SolarWinds’ DEM capabilities are part of its broader observability portfolio, which covers infrastructure, network and application monitoring, making it more suited to the IT operations use case, which is where the vendor achieved its highest score.
Splunk
Since acquiring Splunk in 2024, Cisco has continued to unify its observability portfolio under the Splunk Observability umbrella, with AppDynamics now integrated as both a SaaS and self-managed solution. Cisco also owns ThousandEyes, which is purchased separately, for internet and network intelligence, and Smartlook for session replay and digital experience analytics. Clients prioritizing depth and breadth of IPM capabilities over DEM suite integration should consider ThousandEyes as a viable option for their needs.
Splunk’s ratings in customer journey mapping, real user monitoring, and session replay reflect strong business journey analytics and user experience insights. Ratings for synthetic transaction monitoring, API monitoring, and IPM highlight that its DEM capabilities are distributed across AppDynamics and Splunk Observability, where multiple user interfaces and tools may be involved to support a given use case, with integration efforts still evolving. Splunk’s DEM portfolio has ongoing challenges with onboarding complexity and configuration depth.
Splunk’s highest scores were in business-centric use cases, such as application owner and customer experience specialist. Its lowest scores were in application development, site reliability engineering, and IT operations.
Context
In the digital era, applications play an increasingly vital role as a primary or often sole interface between the customer and the business service. Beyond whether applications are available or performant, an unsatisfactory digital experience for end users navigating shopping carts or completing internal processes has a direct impact on business success. These impacts can be as tangible as shopping cart abandonment, which leads directly to revenue loss, or changes in sentiment, which negatively impacts employee engagement or brand perception.
DEM tools provide actionable insights into application health and performance and can measure the impact of poor experiences on end users. They enable I&O teams to troubleshoot, trend and surface insights relevant to business leaders, such as user journeys and engagement.
DEM is a critical component of the enterprise IT monitoring portfolio. Its adoption continues to be important for several reasons, including the following:
- Customers’ and employees’ increased expectation for a simple and friction-free experience in the digital era as they interact with applications and digital services. In many cases, a website or application is the primary (or only) interface between the business and its customers.
- Lines of business want I&O to ensure that systems are always running and are gathering business-centric insights and performance metrics. Application availability and performance metrics are still needed, but do little to provide insights about customer engagement, journeys or satisfaction.
- SaaS and externally hosted solutions are increasingly creating blind spots for I&O teams that must rely on vendors for issue remediation since they don’t own, or have access to, the system logs and health metrics. Despite this, they are still expected to be proactive, minimize end-user impact, ensure responsible vendors do their job, and take mitigating action.
- The increasing velocity of application releases emphasizes the need for comprehensive monitoring and analytics since any change may impact the experience for users.
Market Definition
Gartner defines digital experience monitoring (DEM) as the measurement of the availability, performance and quality of the user experience of applications. This can include internal users (employees), external users (customers and partners) or a digital agent connecting to an API. In addition to performance, DEM enables observability of user behavior and journeys based on their interaction with applications.
DEM tools allow I&O leaders to understand the availability, performance and reliability of business applications, networks and infrastructure by focusing on understanding the user experience. This is in contrast to other performance monitoring approaches, such as observability platforms, that understand the inner workings of applications.
“User” is defined broadly for DEM tools and may include internal and external users or even digital agents. Use-case examples include understanding the performance and availability of:
- Employees accessing applications critical to their role (e.g., intranet, CRM website)
- Outsourced third-party applications/services where there is no way to directly instrument the outsourced environment
- Customers accessing a commercial website (e.g., retail or online banking application)
- Digital agents connecting to important APIs, ensuring the availability and performance of critical digital components
DEM tools also:
- Help enterprises proactively identify application performance degradation from a user’s point of view
- Understand user behavior and journeys within the application
- Help track important applications’ SLAs
- Enable benchmarking of application performance and issue identification before users are affected (e.g., before and after component upgrade)
- Provide data to help identify the best opportunities to improve website performance
While DEM tools are useful in understanding customer behavior, they differ from customer experience analytics tools in that the primary focus is on measuring the impact of application performance on customers/users. Tools that focus primarily on customer experience are not included in this market.
DEM tools also differ from digital employee experience management (DEX) tools, as DEM focuses more broadly on digital experience for customers or employees, and infrastructure components. DEX focuses exclusively on the digital experience of employees through their company-provided physical and virtual endpoints accessing approved applications and services. DEX incorporates organizational and employee sentiment data, and acts to resolve identified issues. Solutions offering endpoint-only monitoring, or those that focus on or are only provided within security or vendor VPN implementations, are excluded from this research.
Mandatory Features
- Measurement of the health and performance of an IT system from an external, front-end interface perspective, either via a UI or an API.
- Ability to visually display an end-to-end representation of a request, journey or interaction with the system showing points of intersection with system components.
- Ability to interrogate the system to answer questions about the impact that the health and performance of the system has on the user experience or behavior.
Common Features
- Real user monitoring (RUM) — records the interactions of real users within a web application
- Synthetic transaction monitoring (STM) — simulated user interaction through scripts, bots, network traffic simulation or API tests
- Multiple geographic points of presence for synthetic transaction monitoring, and the option to deploy private agents for increased visibility
- Analysis of RUM telemetry, including session replay and customer journey mapping
- SaaS application performance and availability monitoring
- Benchmarking key performance metrics for establishing baselines and comparison and trend analysis
- Provide actionable insights through the use of advanced analytics and machine learning that are otherwise not possible or feasible to derive through manual interrogation and analysis of data.
- Support for browser emulation and automation languages such as Selenium, Cypress, Playwright and Puppeteer
- Internet performance monitoring — ability to provide insight into cloud services and the optimum paths available
- Thick client monitoring — capability to deploy DEM to non-web-based interfaces
- Integration with adjacent domains such as security monitoring and software testing
- Mobile application monitoring via software development kits (SDKs)
- Integrations with application performance monitoring or observability platforms to see a drill-down at the transaction level that shows how the application spends time when responding to a user request
Product/Service Class Definition
DEM tools are used to understand the impact of poor application performance on user experience by a variety of teams across I&O. For example:
- DevOps practices have led to an increase in consideration of monitoring during the entire application life cycle. As such, application developers use synthetic transaction monitoring during the development and release phases as part of the testing cycle to automate functional testing and compare performance across releases. These same synthetic transactions can then be reused in production to monitor ongoing operational performance, providing a baseline for consistent view of application performance across the application life cycle.
- Site reliability engineering teams must balance the velocity of feature releases with reliability and user experience and leverage real user monitoring to assess any impact on user experience. This enables them to provide feedback to development teams and help accelerate product and architecture optimization and enhancements.
- Application owners concerned with business performance and the impact of applications on strategically important services can use session replay and customer journey mapping to identify how application performance and releases impact customer experience and resultant behavior.
- IT operations teams take a digital experience perspective to close gaps in visibility for applications and services that are not under their direct control, such as SaaS-hosted or those reliant on third-party, internet-based services.
Among the vendors in this report, there are some clear trends in the implementation of DEM:
- Observability platform vendors are emerging as full-stack solution providers, offering the broadest set of DEM capabilities combined with correlation with observability telemetry targeted at use cases that extend beyond application health and performance monitoring.
- Dedicated DEM solution vendors provide specific focus on the customer experience and performance across multiple providers.
- While some DEM capabilities, such as real user monitoring and synthetic transaction monitoring, are prevalent across the majority of vendors, a select few offer products that specifically focus on capabilities such as internet performance monitoring.
- AI is a common theme among vendors, with capabilities currently available in some products, as well as some vendors planning for future enhancements, reflecting varying levels of maturity across vendors.
I&O leaders typically use the following strategies when deploying a DEM solution:
- I&O teams that take a holistic view of applications — from code level through middleware and infrastructure components and including the digital experience layer — tend to use observability platforms.
- I&O teams dealing with complex environments — where business processes and customer transactions span multiple third-party vendors and service providers — prefer dedicated DEM solutions that monitor application performance and the experience of users.
- Enterprises seeking a complete DEM solution covering all capabilities in this report require either a suite of solutions from an individual vendor or a combination of products from several vendors.
Critical Capabilities Definition
RUM and Session Replay
RUM measures real-time user experience from the application’s perspective. Session replay records user experience via RUM, which can later be viewed to see a user’s mouse movements and understand what they were doing, the trouble they experienced and why they left their user journey.
Real user monitoring captures core web vitals and performance metrics, and combines this with metadata related to the user sessions (such as geographic location, device type, and browser type and version). It provides insights into digital experience for individuals or groups of users. The open-source Application Performance Index (Apdex) score can be used to provide a standardized measure of user satisfaction. More advanced implementations include sampling, using analytics to assess performance over time, and the ability to mask sensitive data for data privacy compliance.
Session replay provides a visual playback of the user interactions overlaid with real user monitoring data including front-end events, user session metadata and performance metrics. It provides insight into how application performance impacts user experience and resultant behavior, such as rage clicks or shopping cart abandonment.
As with real user monitoring, session replay includes the ability to sample data in order to control costs and mask sensitive information.
Customer Journey Mapping
Customer journey mapping analyzes RUM data to visualize user paths in an application, tracking visited pages and the order in which they are visited. Analysis of this data shows how users navigate an application, the highest-traffic areas of the application and areas possibly impacted by the load.
Customer journeys are visually depicted in Sankey or funnel diagrams that show journey entry, exit and attrition across a process such as selecting an item, adding it to a cart and checking out. More advanced implementations show how user experience impacts business metrics such as conversion rate and the revenue impact of shopping cart abandonment.
STM and API Monitoring
STM uses scripts to simulate interactions and spot performance issues before users are affected. Tests can be hosted by DEM vendors or as private agents to measure performance near concentrations of users. API monitoring tracks performance, availability, service-level experience and usage patterns.
Synthetic transaction monitoring complements real user monitoring by providing a proxy for user experience where real user data is not available (either due to a low volume of users or limitations in the ability to instrument the application for real user data collection). Synthetic transaction monitoring is increasingly used during the application development cycle to provide performance comparison between releases.
STM includes the ability to emulate different browsers, analyze core web vitals and performance metrics, alert on anomalous patterns of performance, and support multifactor authentication. Synthetic transaction monitoring data can be presented alongside real user data to assist in root cause analysis.
API monitoring extends the scope of digital experience monitoring from the user interface to the system interface. Capabilities are differentiated by their support for multiple API protocols, ability to cater to multistep API calls and support for security management.
Mobile App Monitoring
DEM mobile application monitoring includes RUM or STM capabilities customized for mobile applications. RUM utilizes app instrumentation to track user activity, while STM employs scripts to analyze applications on emulated mobile devices.
This capability includes the ability to emulate mobile devices, provide session replay and capture user device and location data.
Internet Performance Monitoring
Internet performance monitoring captures the performance of network infrastructure nnot controlled by an organization but which may impact the health and performance of applications accessed via the internet. This could include Border Gateway Patrol, content delivery network or DNS, for example.
Internet performance monitoring typically includes monitoring the speed, reliability and overall quality of internet connections, as well as the performance of web applications and services delivered over the internet. Typical metrics collected include latency, bandwidth utilization, packet loss and jitter, uptime and availability as well as differences in geographic performance.
Internet performance monitoring typically includes monitoring the speed, reliability and overall quality of internet connections, as well as the performance of web applications and services delivered over the internet. Typical metrics collected include latency, bandwidth utilization, packet loss and jitter, uptime and availability as well as differences in geographic performance.
Use Cases
Application Development
Application development designs, creates, tests and deploys software, the performance of which directly impacts the digital experience of users who consume digital services.
Understanding the impact that application code has on user experience is crucial as it influences user satisfaction, engagement and, ultimately, the success of the business services offered. Application developers mainly leverage synthetic transaction monitoring, API monitoring and mobile app monitoring. These capabilities enable developers to automate testing and evaluate the impact that new code releases have on application performance and customer experience.
In production environments, real user monitoring, session replay and customer journey mapping provide valuable insights into how users are navigating applications, surface issues related to specific devices or browser versions. They also help to troubleshoot performance issues from the end users’ perspective.
Site Reliability Engineering
SRE enables cross-functional teams to design and operate scalable, resilient systems with complex modern architectures to meet service-level objectives.
With key focus areas including setting and adhering to business-centric service-level objectives and customer-centric operations, site reliability engineering teams use a broad range of DEM capabilities to deliver reliable applications that are aligned with business outcomes.
Real user monitoring, session replay and customer journey mapping are at the forefront of the ability of site reliability engineering to understand the end-user experience and any impact that degraded performance has on meeting service-level objectives. These insights help in prioritization of new feature releases versus performance enhancements. When combined with API monitoring, network path analysis and internet performance monitoring, site reliability engineering gathers the data needed to quickly assess potential root causes of performance issues that extend beyond the application itself.
IT Operations
IT operations covers a variety of technical domains and is typically tasked with keeping the infrastructure operating efficiently.
IT operations practitioners may be in specific silos, such as the network team, server team, virtualization team, application support team or other cross-functional teams (such as a generalized monitoring team).
They use DEM capabilities like synthetic transaction monitoring, API monitoring and internet performance monitoring to gather data about applications and services hosted by third-party service providers. Real user monitoring provides insights into challenges faced by individuals or groups of users to aid troubleshooting.
Application Owner
Application owners act as a bridge between stakeholders and the development team, ensuring alignment with market demands and company objectives.
Making strategic decisions based on customer feedback makes real user monitoring and customer journey mapping crucial in understanding the customer experience. For off-the-shelf applications, synthetic transaction monitoring and the ability to support thick-client applications are also useful.
Customer Experience Specialist
CX specialists optimize digital channels such as social media, websites and mobile apps to improve delivery of contextualized digital experiences across customer journeys.
Customer experience specialists understand customer needs, address their concerns, improve overall satisfaction and boost customer engagement in digital brands and products. While there is a dedicated market serving web product and digital experience analytics, this is also a use case for DEM.
Insights into how users interact with digital products — including navigation patterns, click paths and dwell times — allow customer experience specialists to analyze user behavior and identify common pain points and areas where users struggle. Session replay and customer journey mapping are particularly useful in helping to gain these insights.
Vendors Added and Dropped
Added
- Checkly
- Conviva
Dropped
No vendors were dropped from this Critical Capabilities.
Inclusion Criteria
The inclusion criteria represents the specific attributes that analysts believe are necessary for inclusion in this body of research.
In addition, the vendor must rank among the top organizations using the Customer Interest Indicator (CII) defined by Gartner for the companion Magic Quadrant. CII is calculated using a weighted mix of internal and external inputs that reflect Gartner client interest, vendor customer engagement and client sentiment.
To qualify for inclusion, providers must meet the following inclusion criteria.
Market Participation Inclusion Criteria:
- Provide generally available capabilities as of 16 June 2025. General availability means the product or service is widely available to all customers for purchase through normal sales channels.
- Sell the DEM tool directly to paying customers without requiring them to engage professional services help. The vendor must provide at least first-line support for these capabilities, including any bundled open-source software. This includes but is not limited to comprehensive product documentation, installation guidance and reference examples.
- Demonstrate an active product roadmap, and go-to-market and selling strategy for their DEM solution.
- Have phone, email and/or web customer support. Vendors must offer contract, console/portal, technical documentation and customer support in English (either as the product’s default language or as an optional localization).
Functionality Inclusion Criteria:
- The DEM tool must offer all mandatory and three of the five common features described in Gartner’s market definition.
- The DEM tool must be delivered via SaaS. Vendors may also provide self-hosted alternatives for clients that require them, but the self-hosted options are outside the scope of this research.
Performance Threshold Achievement:
- The DEM tool must have at least 50 paying, production (non-beta-test) customers in at least two geographic regions (Asia/Pacific, EMEA, Latin America or North America) excluding sales to managed service providers (MSPs), or
- The DEM tool must have generated at least $5 million in annual generally accepted accounting principles (GAAP) revenue during the 12 calendar months prior to June 2025.
Weighting for Critical Capabilities in Use Cases
| Critical Capabilities | Application Development | Site Reliability Engineering | IT Operations | Application Owner | Customer Experience Specialist |
|---|---|---|---|---|---|
RUM and Session Replay | 20% | 25% | 35% | 30% | 50% |
Customer Journey Mapping | 10% | 5% | 0% | 35% | 30% |
STM and API Monitoring | 40% | 40% | 30% | 20% | 0% |
Mobile App Monitoring | 30% | 20% | 15% | 15% | 20% |
Internet Performance Monitoring | 0% | 10% | 20% | 0% | 0% |
Source: Gartner (October 2025)
This methodology requires analysts to identify the critical capabilities for a class of products/services. Each capability is then weighted in terms of its relative importance for specific product/service use cases.
Critical Capabilities Rating
Each of the products/services that meet our inclusion criteria has been evaluated on the critical capabilities on a scale from 1.0 to 5.0.
Product/Service Ratings on Critical Capabilities
| Critical Capabilities | Blue Triangle | Catchpoint | Checkly | Conviva | Datadog | Dynatrace | IBM | ip-label | ITRS Group | ManageEngine | New Relic | Riverbed | SolarWinds | Splunk |
|---|---|---|---|---|---|---|---|---|---|---|---|---|---|---|
RUM and Session Replay | 3.5 | 3.9 | 1.0 | 3.4 | 4.5 | 4.1 | 2.5 | 1.8 | 2.0 | 3.8 | 4.0 | 3.3 | 2.9 | 3.3 |
Customer Journey Mapping | 3.7 | 1.5 | 1.0 | 3.5 | 4.3 | 4.0 | 3.3 | 1.0 | 1.0 | 2.2 | 3.5 | 3.8 | 1.0 | 3.5 |
STM and API Monitoring | 2.3 | 4.1 | 3.8 | 1.0 | 4.1 | 3.9 | 3.7 | 3.1 | 3.5 | 3.1 | 3.4 | 3.8 | 3.0 | 3.1 |
Mobile App Monitoring | 1.8 | 3.5 | 1.0 | 3.3 | 3.5 | 3.8 | 3.3 | 3.0 | 2.5 | 3.2 | 3.3 | 3.8 | 1.0 | 2.8 |
Internet Performance Monitoring | 1.8 | 4.4 | 1.0 | 2.0 | 2.3 | 2.9 | 3.5 | 1.0 | 1.0 | 3.0 | 3.3 | 3.0 | 3.0 | 2.5 |
Source: Gartner (October 2025)
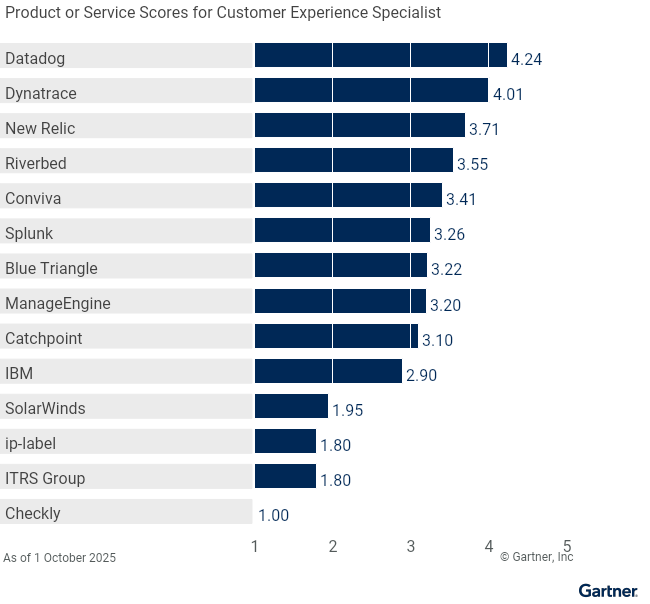
Table 3 shows the product/service scores for each use case. The scores, which are generated by multiplying the use-case weightings by the product/service ratings, summarize how well the critical capabilities are met for each use case.
Product Scores in Use Cases
| Use Cases | Blue Triangle | Catchpoint | Checkly | Conviva | Datadog | Dynatrace | IBM | ip-label | ITRS Group | ManageEngine | New Relic | Riverbed | SolarWinds | Splunk |
|---|---|---|---|---|---|---|---|---|---|---|---|---|---|---|
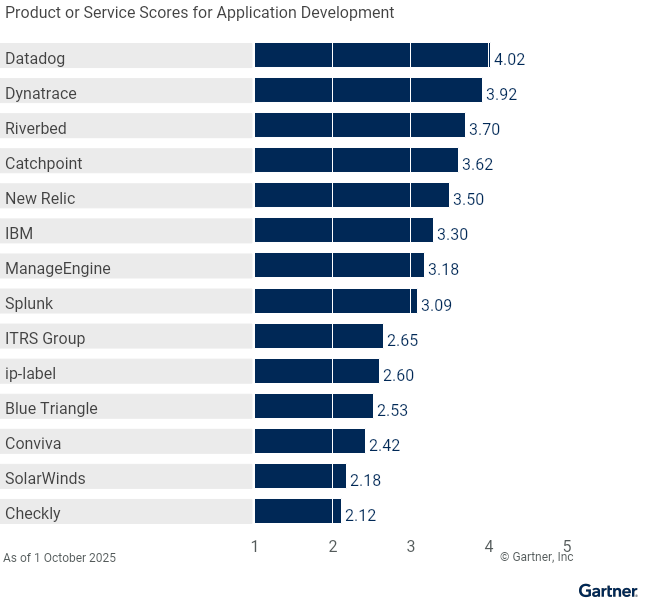
Application Development | 2.53 | 3.62 | 2.12 | 2.42 | 4.02 | 3.92 | 3.30 | 2.60 | 2.65 | 3.18 | 3.50 | 3.70 | 2.18 | 3.09 |
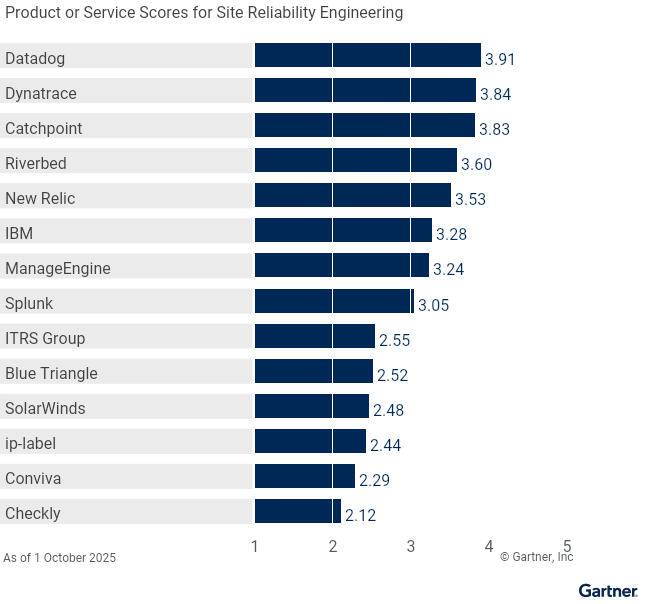
Site Reliability Engineering | 2.52 | 3.83 | 2.12 | 2.29 | 3.91 | 3.84 | 3.28 | 2.44 | 2.55 | 3.24 | 3.53 | 3.60 | 2.48 | 3.05 |
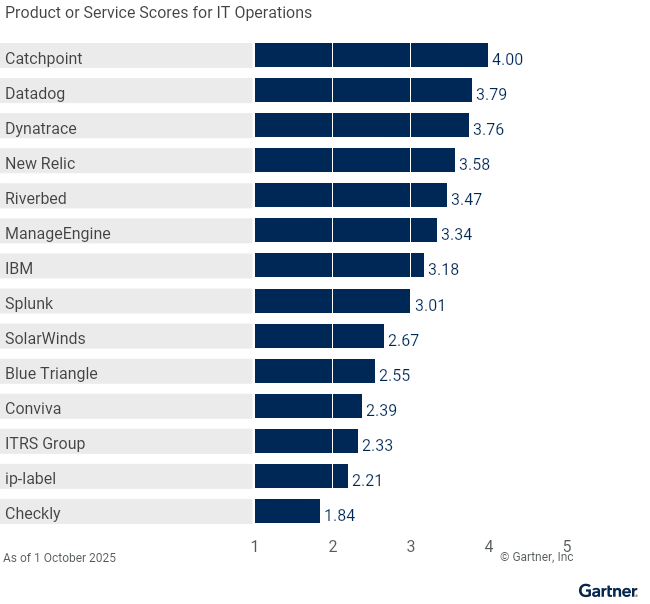
IT Operations | 2.55 | 4.00 | 1.84 | 2.39 | 3.79 | 3.76 | 3.18 | 2.21 | 2.33 | 3.34 | 3.58 | 3.47 | 2.67 | 3.01 |
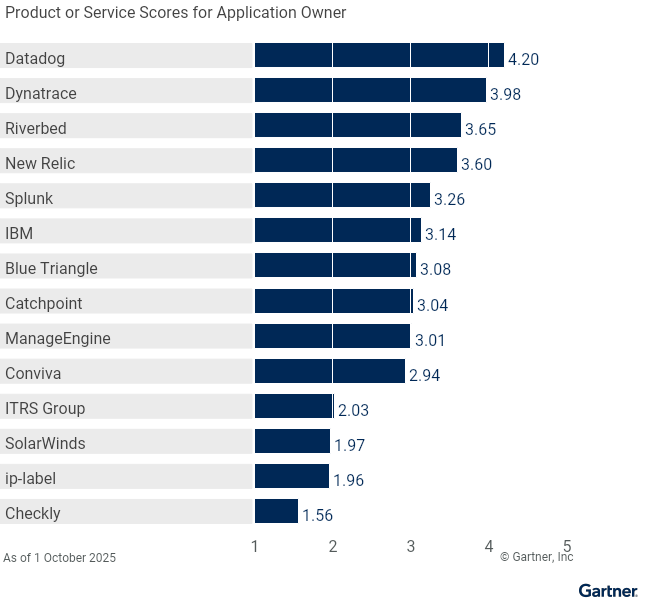
Application Owner | 3.08 | 3.04 | 1.56 | 2.94 | 4.20 | 3.98 | 3.14 | 1.96 | 2.03 | 3.01 | 3.60 | 3.65 | 1.97 | 3.26 |
Customer Experience Specialist | 3.22 | 3.10 | 1.00 | 3.41 | 4.24 | 4.01 | 2.90 | 1.80 | 1.80 | 3.20 | 3.71 | 3.55 | 1.95 | 3.26 |
Source: Gartner (October 2025)
To determine an overall score for each product/service in the use cases, multiply the ratings in Table 2 by the weightings shown in Table 1.
Critical Capabilities Methodology
This methodology requires analysts to identify the critical capabilities for a class of products or services. Each capability is then weighted in terms of its relative importance for specific product or service use cases. Next, products/services are rated in terms of how well they achieve each of the critical capabilities. A score that summarizes how well they meet the critical capabilities for each use case is then calculated for each product/service.
"Critical capabilities" are attributes that differentiate products/services in a class in terms of their quality and performance. Gartner recommends that users consider the set of critical capabilities as some of the most important criteria for acquisition decisions.
In defining the product/service category for evaluation, the analyst first identifies the leading uses for the products/services in this market. What needs are end-users looking to fulfill, when considering products/services in this market? Use cases should match common client deployment scenarios. These distinct client scenarios define the Use Cases.
The analyst then identifies the critical capabilities. These capabilities are generalized groups of features commonly required by this class of products/services. Each capability is assigned a level of importance in fulfilling that particular need; some sets of features are more important than others, depending on the use case being evaluated.
Each vendor’s product or service is evaluated in terms of how well it delivers each capability, on a five-point scale. These ratings are displayed side-by-side for all vendors, allowing easy comparisons between the different sets of features.
Ratings and summary scores range from 1.0 to 5.0:
1 = Poor or Absent: most or all defined requirements for a capability are not achieved
2 = Fair: some requirements are not achieved
3 = Good: meets requirements
4 = Excellent: meets or exceeds some requirements
5 = Outstanding: significantly exceeds requirements
To determine an overall score for each product in the use cases, the product ratings are multiplied by the weightings to come up with the product score in use cases.
The critical capabilities Gartner has selected do not represent all capabilities for any product; therefore, may not represent those most important for a specific use situation or business objective. Clients should use a critical capabilities analysis as one of several sources of input about a product before making a product/service decision.