Voice of the Customer for Network Security Microsegmentation
22 January 2026 - ID G00844763 - 4 min read
By Peer Community Contributor
Network security microsegmentation tools allow organizations to create dynamic access policies between individual assets and applications across cloud environments. This note guides cybersecurity leaders to learn from ratings and reviews by their peers shared on Gartner Peer Insights.
To view the Interactive Voice of the Customer for this market, click the Launch button at the top of this page.
What Is Network Security Microsegmentation?
Gartner defines network security microsegmentation — also referred to as zero-trust network segmentation — as an effort that can create more granular and dynamic access policies than traditional network segmentation (often north-south traffic segmentation). It allows the insertion of a security policy between any two workloads in the same broadcast domain — with microsegmentation technologies narrowing fine-grained network zones down to individual assets and applications. Microsegmentation tools support the implementation of finer-grained zoning across public, private and hybrid cloud infrastructures. Cybersecurity leaders must understand the key features, use cases and role of microsegmentation in their environment, as well as determine which model is the best fit for their needs.
What Is Gartner Peer Insights “Voice of the Customer”?
“Voice of the Customer” synthesizes Gartner Peer Insights reviews into insights for buyers of technology and services. This aggregated peer perspective, along with the individual detailed reviews, is complementary to Gartner’s expert research and can play a key role in your buying process. Peers are verified reviewers of a technology product or service, who not only rate the offering, but also provide valuable feedback to consider before making a purchase decision. You can read individual reviews and ratings on the Gartner Peer Insights page for this market.
Along with the historical peer-based perspective represented in this document, Gartner has a related expert-led Market Guide for Network Security Microsegmentation.
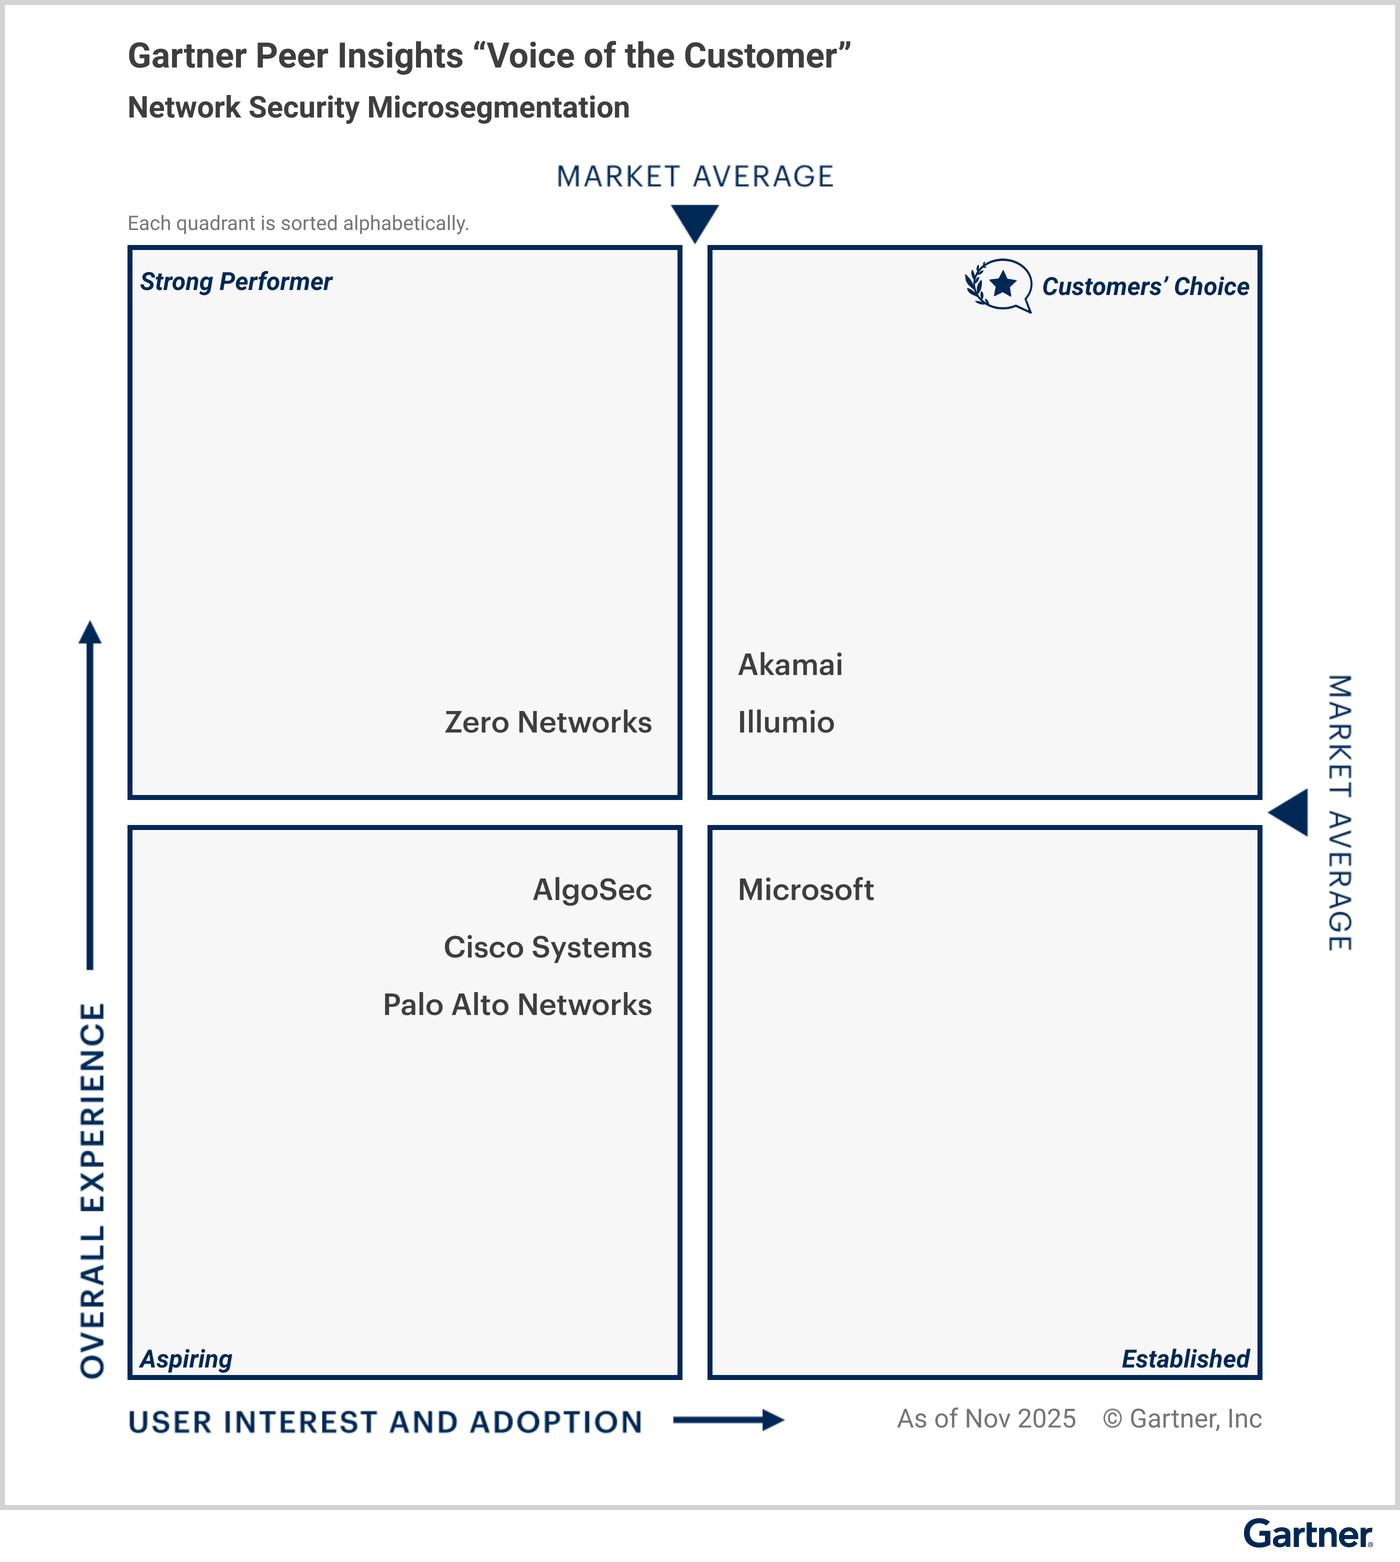
Figure 1 shows all “Voice of the Customer” eligible vendors in the market categorized into four quadrants based on scores assigned for User Interest and Adoption (x-axis), and Overall Experience (y-axis). The midpoint of each axis, labeled “market average,” represents the average score as calculated exclusively from vendors included in the document. See Gartner Peer Insights Voice of the Customer Methodology for details.
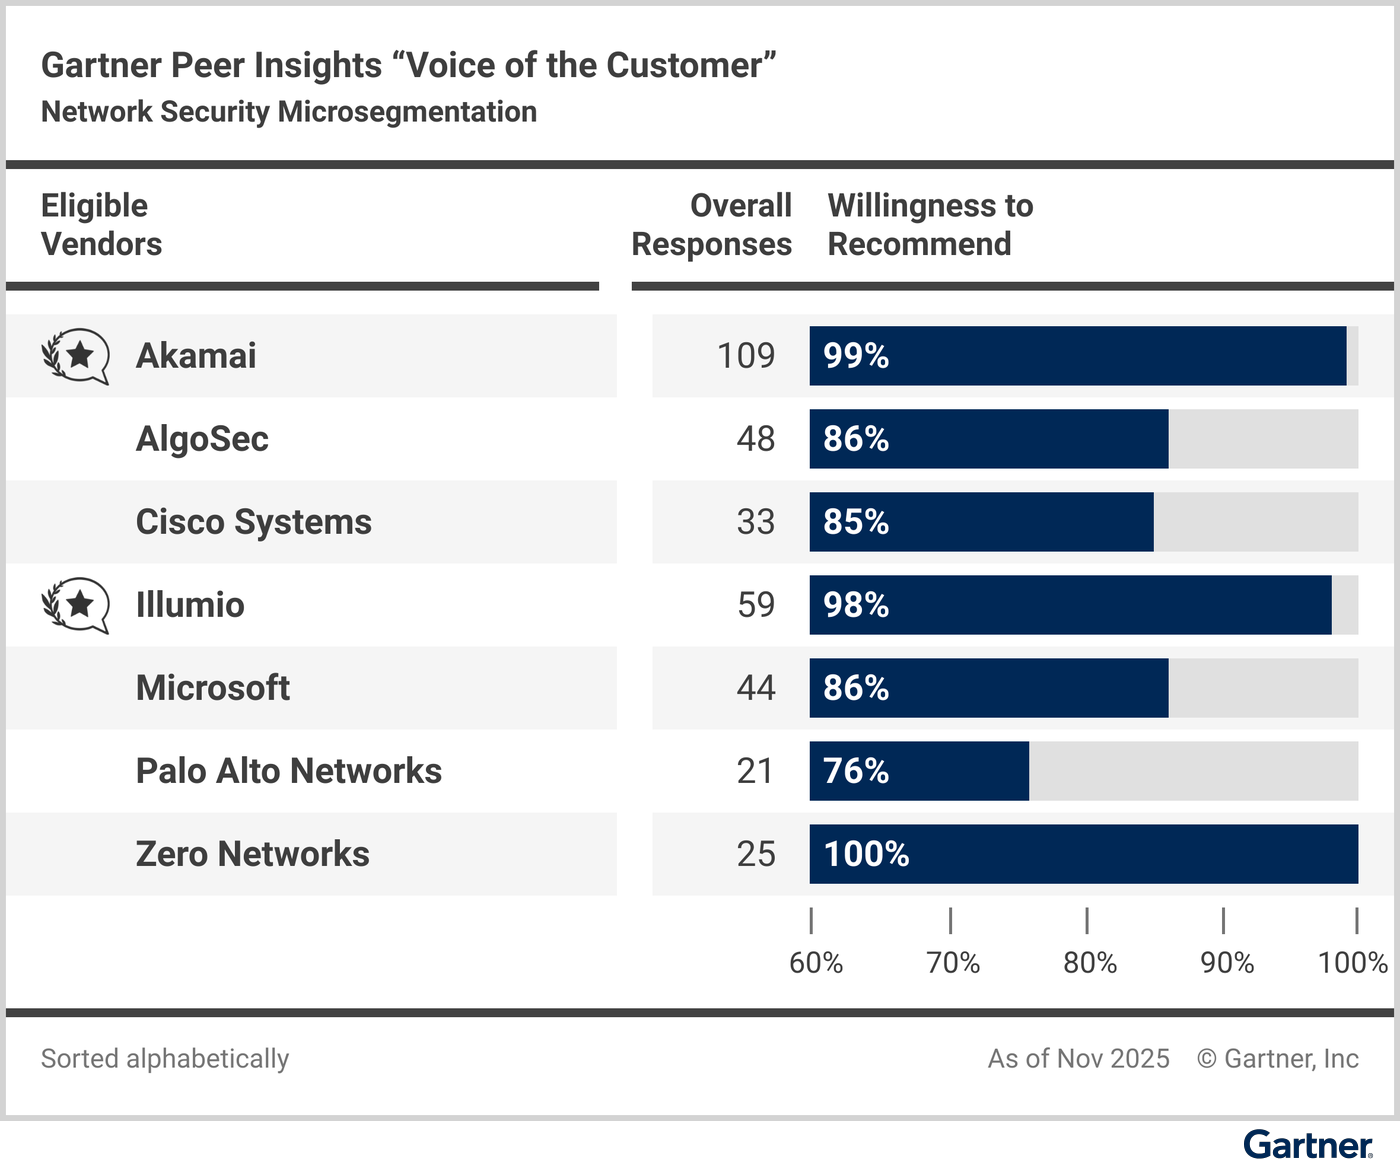
Network Security Microsegmentation Willingness to Recommend
Gartner Peer Insights reviewers rate their willingness to recommend each vendor. Figure 2 compares vendors according to the reviewers’ willingness to recommend them. See Gartner Peer Insights Voice of the Customer Methodology for details.
Vendor Summaries
Figures 3 through 9 summarize key information for each vendor included in the “Voice of the Customer”:
- Reviewer demographics for reviews received in the 18-month review period, ending 30 November 2025
- Overall Rating and rating distribution
- Other ratings covering specific aspects of the experience with the vendor

Read all Peer Insights user reviews for Akamai.
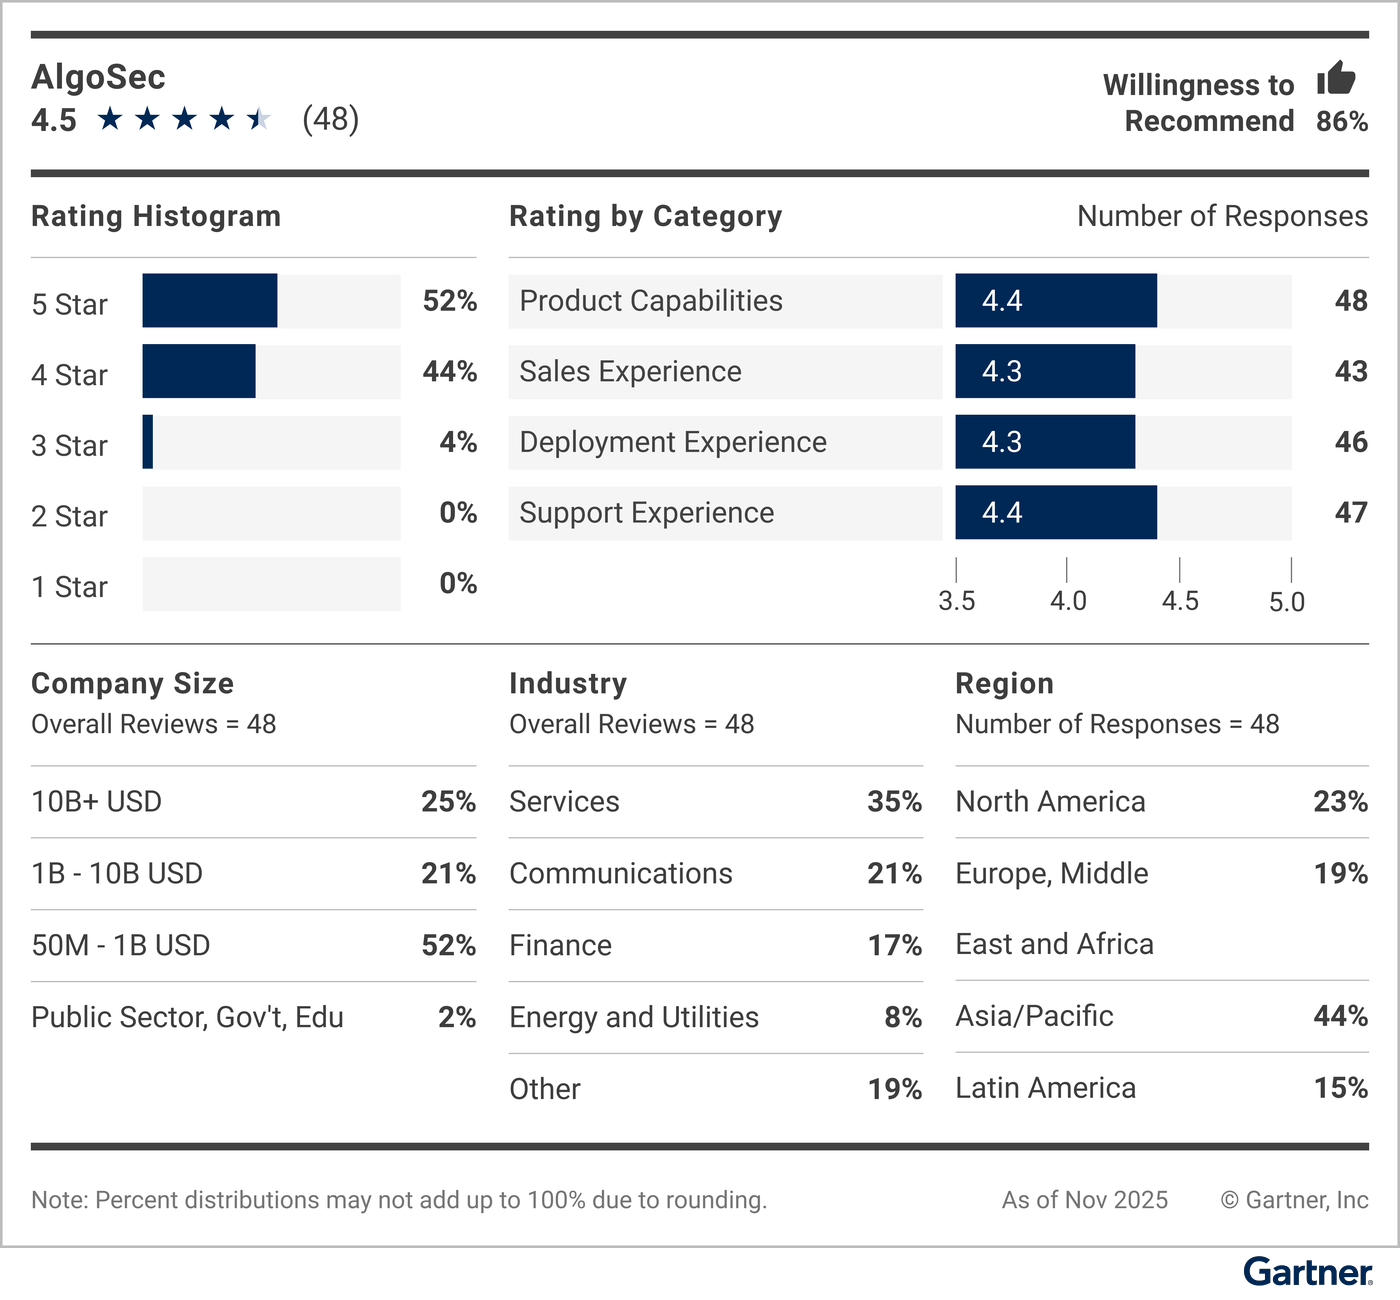
Read all Peer Insights user reviews for AlgoSec.
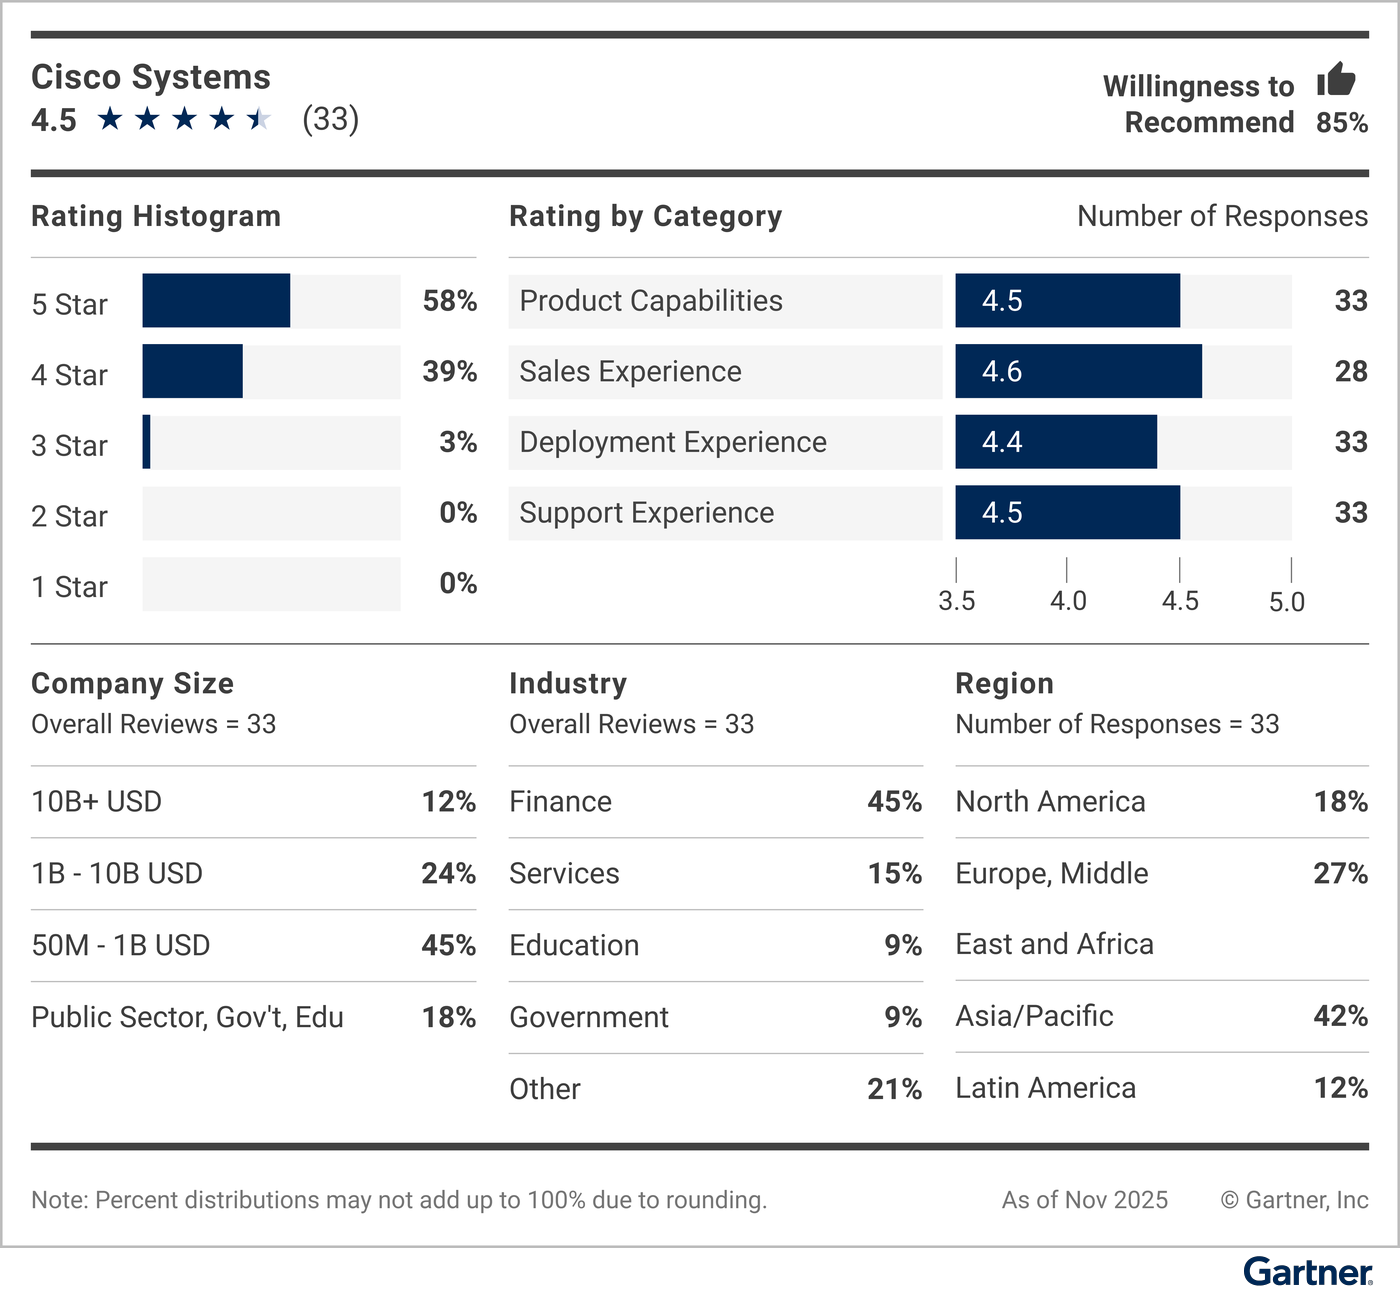
Read all Peer Insights user reviews for Cisco Systems.
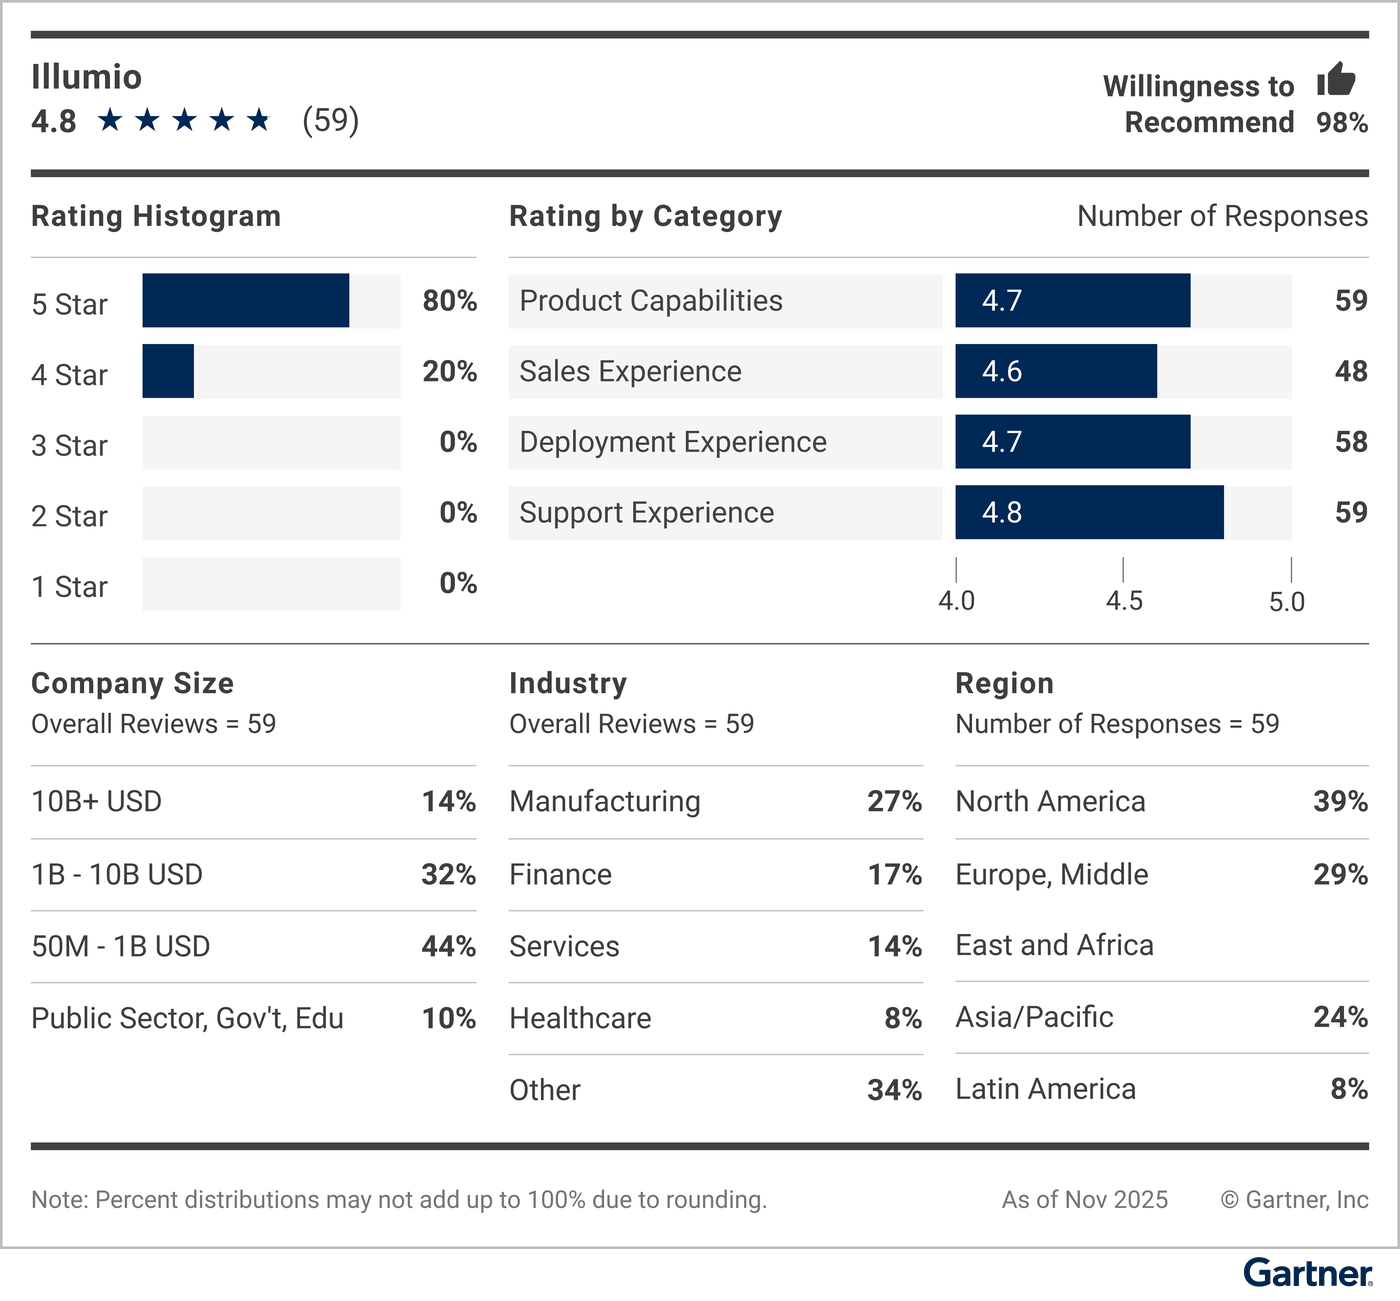
Read all Peer Insights user reviews for Illumio.
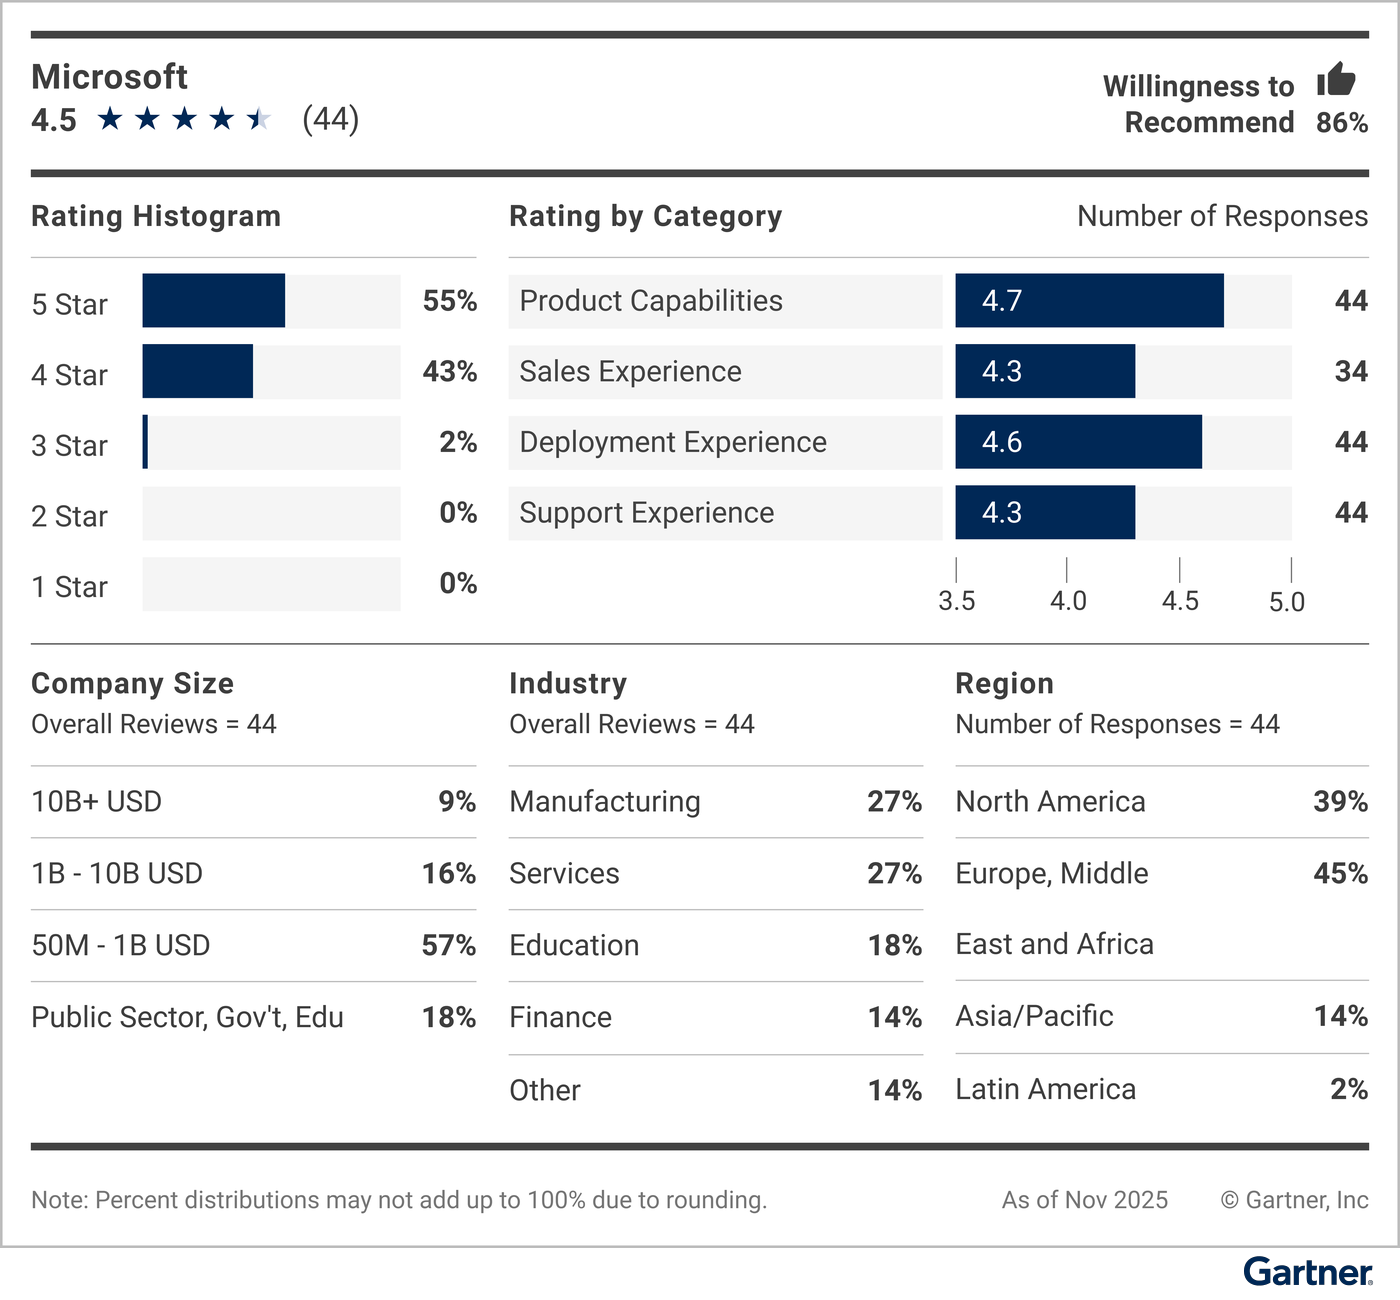
Read all Peer Insights user reviews for Microsoft.
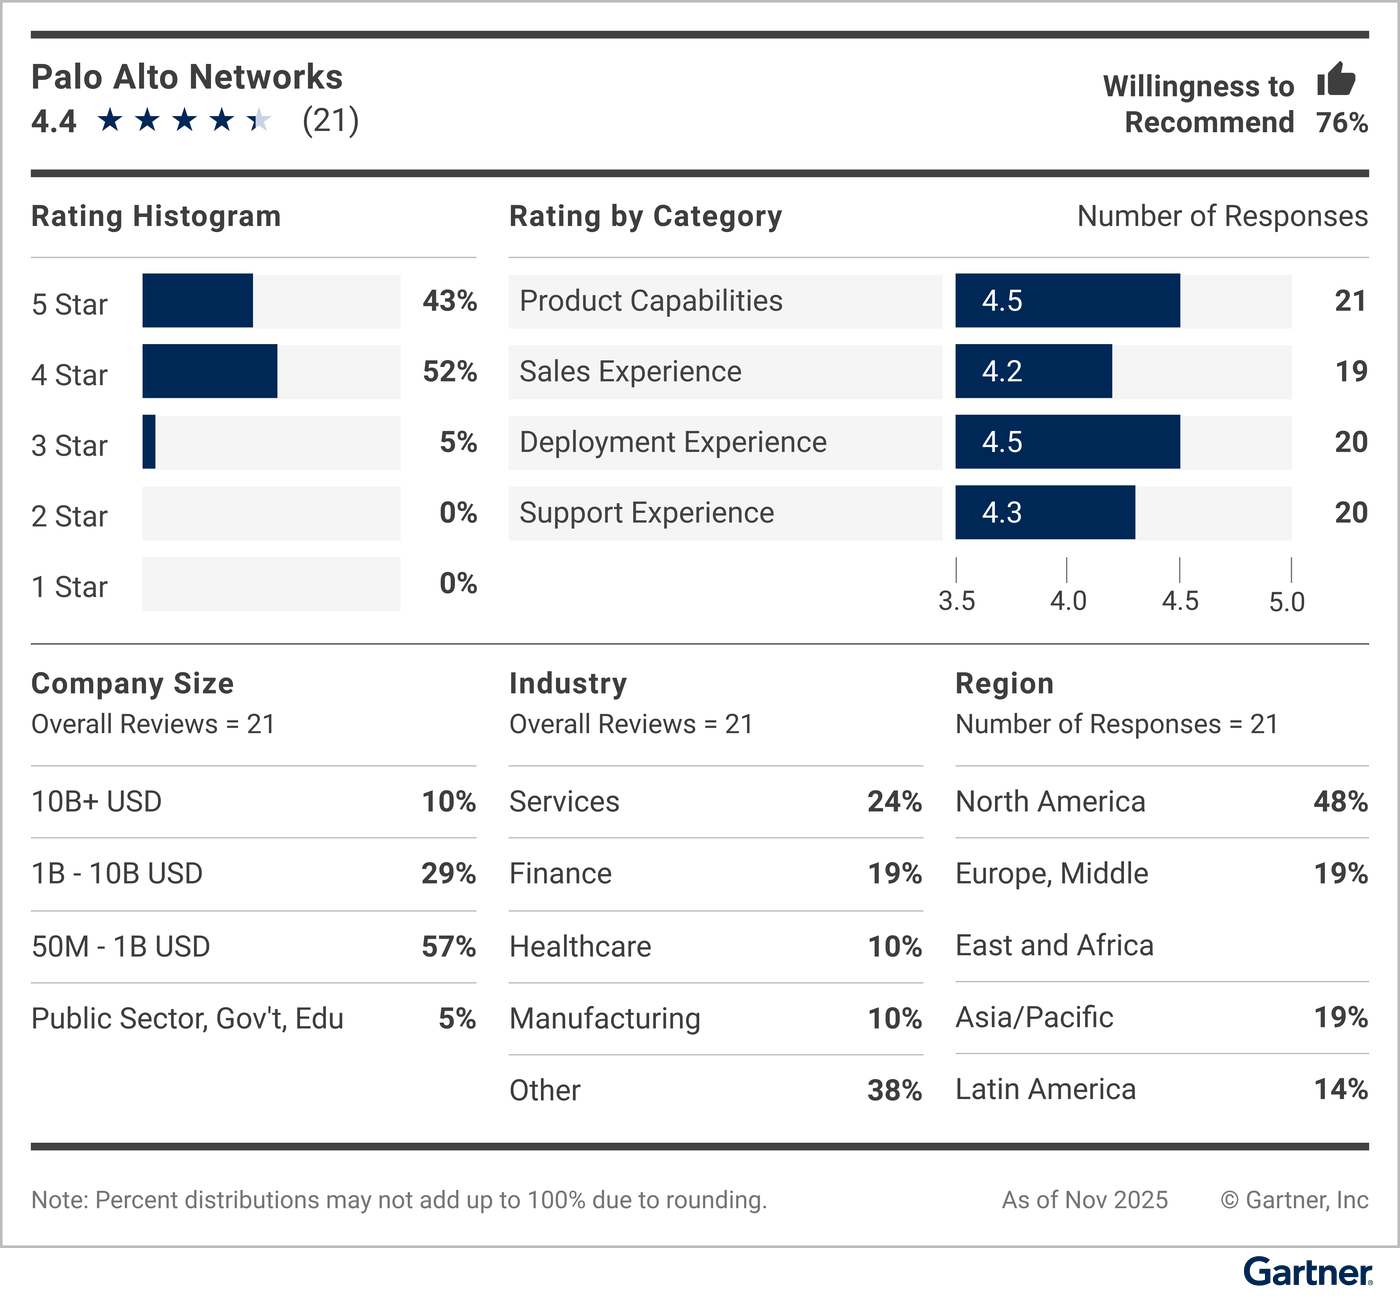
Read all Peer Insights user reviews for Palo Alto Networks.
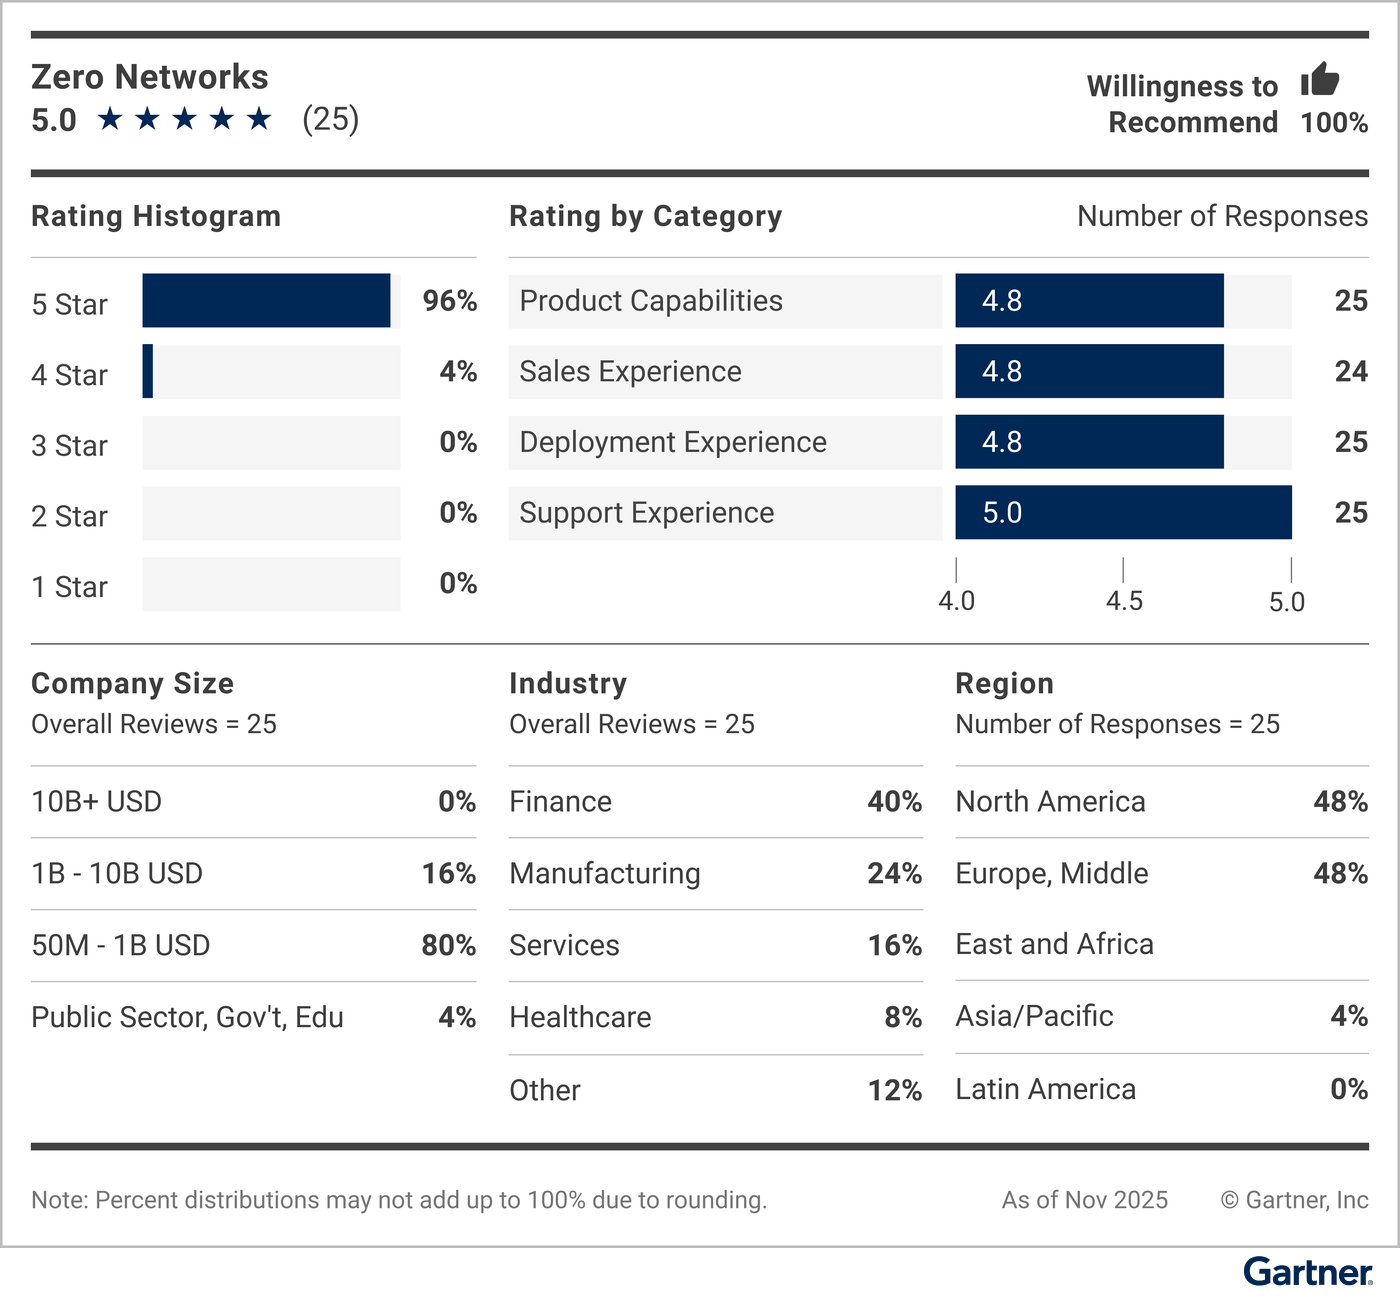
Read all Peer Insights user reviews for Zero Networks.
Methodology
A full description of the methodology can be found on the Gartner Peer Insights Voice of the Customer Methodology page.
Voice of the Customer includes vendors with products aligned to the market that have 20 or more eligible published reviews (and 15 or more ratings for “Capabilities” and “Support/Delivery”) during the 18-month consideration period ending 30 November 2025. Reviews from vendor partners or companies with less than $50 million in revenue are excluded.
In the network security microsegmentation market, Gartner Peer Insights published 592 reviews and ratings during the consideration period.
The data used in this report is drawn from reviews on Peer Insights, a free peer review and ratings platform that regularly publishes new reviews. The “Voice of the Customer” methodology uses a snapshot of reviews data from a defined timeframe and does not automatically update as new reviews are published. The external Peer Insights site will always have the most updated peer view of the vendors and products in this report.
The numerical ratings scores in each vendor summary graphic (shown as “Rating by Category”) are best interpreted as sample statistics with a reasonable margin for error and not as exact values.