Market Guide for Data Observability Tools
23 February 2026 - ID G00839851 - 51 min read
By Melody Chien, Michael Simone
Data observability has emerged as a critical capability to ensure the health, quality, and reliability of data and data pipelines. As companies increasingly rely on data to power decision making, operational efficiency, and AI initiatives, D&A leaders should leverage data observability tools for end-to-end data assurance and proactive issue resolutions.
Overview
Key Findings
- The challenge of having a robust and holistic view of data health is pervasive, especially when data architectures are becoming more complex, spanning from distributed cloud data warehouses, streaming pipelines, real‐time transformational workflows, and GenAI and agentic AI systems.
- AI and agentic AI are driving the adoption of data observability tools, with organizations pivoting away from full-table scans to the analysis of metadata, log signals, and telemetry from data systems. The objective is to provide a holistic view of data health, enabling teams to detect anomalies, trace issues through data lineage, and take corrective actions before the problems escalate in supporting AI use cases.
- As organizations strive for data reliability and operational efficiency, data observability capabilities have gone from being a “nice‐to‐have” feature into a tactical necessity, as the adoption rate of these tools has increased.
- AI augmentation has become an important driver for the evolution of data observability tools. The role of AI in observability tools will continue to grow with more advanced applications in predictive analytics, anomaly forecasting, and automated remediation. As vendors refine their AI capabilities, organizations can expect faster identification, resolutions, and even prevention of data issues.
- The market trend is moving toward unified platforms that combine various observabilities, data governance, and security into a single pane of glass. This integration will simplify operations, reduce costs associated with tool sprawl, and improve overall system reliability.
Recommendations
D&A leaders assessing the data observability market must:
- Identify gaps in the current data ecosystem, and use them as opportunities for piloting data observability tools. Ideal piloting opportunities for testing data observability tools are areas where current monitoring cannot sufficiently identify critical issues, SLAs are not met, or data delivery requires long-running tasks.
- Evaluate vendors with both technology and business in mind. Engage both business and technical personas early in the vendor evaluation process to evaluate a data observability tool based on the business and enterprise ecosystem’s requirements.
- Prioritize piloting data observability tools that support the connectivities to your critical data systems. If possible, target cloud environments first (which are the primary focus among vendors and allow easier data observability tool implementations) to quickly assess the improvement of data quality within data pipelines and the impact on business outcomes.
- Secure business value from data observability practices by embedding them into DataOps and data governance framework(s), and adjusting business processes, responsibilities, and skill sets to respond to the increased level of incidents detected and resolution through observation.
- Evaluate the total cost of ownership (TCO) and expected return on investment carefully to ensure that the data observability tools are making a sustainable financial commitment.
Market Definition
Data observability tools enable organizations to understand the state and health of their data, data pipelines, data landscapes, and data infrastructures, as well as the associated financial costs, across distributed environments. This is accomplished by continuously monitoring, detecting, alerting, analyzing, and troubleshooting data workflows to identify and resolve issues, thereby reducing and preventing data issues and system downtime. The tools also provide information on data lineage, collaborations, and incident management. They go beyond traditional network or application monitoring by enabling users to observe changes, discover unknown issues, and take appropriate actions to deliver reliable data and prevent business interruption.
With the growing demand for supporting data and AI initiatives, the distribution of data landscapes, diversity of datasets, and requirements for high-quality data are also increasing. Organizations are seeking effective methods to gain comprehensive visibility into the health of data across various stages of the data life cycle. However, traditional monitoring tools are insufficient to meet this demand. These tools are event-based and focus on specific areas of the data ecosystem, assuming users already know what they’re looking for. Thus, they are insufficient to address new issues that were not previously understood or detected. Data observability tools learn what to monitor and provide insights into unforeseen exceptions. They fill the gap for organizations that need better visibility on data health and data pipelines across distributed landscapes. Data observability tools address a subset of challenges related to data quality, visibility, timely detection, root cause analysis, scalability, governance, and cross-team collaboration to help organizations maintain trustworthy and reliable data for all their needs.
Mandatory Features
- Monitoring and detection: As one of the most fundamental features of data observability, monitoring tracks data content against business rules, policies, or standards; detects changes in schema, or data (nulls, typecasts, min/max, etc); evaluates the data quality threshold; monitors data flows; and identifies data-related issues. The tools have embedded monitoring dashboards and reports to display the real-time or point-in-time status of data and data pipelines.
- Data quality checks and validation: These features profile data as it moves through systems, assessing characteristics like duplicates and statistical distributions. Automated validation tests also enforce predefined quality rules (for example, “column A should never have negative values” or “column B must contain values that have been defined in table X”). When these rules are violated, the system triggers alerts.
- Alert and triage: Data observability tools can determine the urgency and severity of issues by identifying their impacts based on the lineage and usage of data. If the data quality status falls below a given threshold or data issues are identified, the tools will send alerts to the relevant people at the appropriate time. The notification frequency can be configured based on the alert levels. It can then trigger incident management workflows.
- Data lineage and impact analysis: These tools enable visualization of the data’s entire journey, from its source through transformations to its final destination. Some platforms delve into granular details, such as column-level lineage, which is crucial for regulatory compliance, debugging, and auditing purposes. Data lineage helps determine the downstream business impact and identify which reports or AI models may be affected.
- Root cause analysis: Automated diagnostics help pinpoint the underlying data issues, such as data quality degradation or pipeline failures. The tools integrate different types of telemetry (logs, metrics, and traces) and are aided by data lineage tools to identify the underlying root cause of the problems.
- Extensibility and integration: A robust observability solution must easily integrate with various data connectors, extraction, transformation and loading (ETL)/extract, load, transform (ELT) platforms, data warehouses (such as Snowflake, BigQuery, and Redshift), orchestration tools (like Apache Airflow or dbt), and BI systems.
Common Features
- Incident management and messaging system integration: Many observability tools come with built-in incident management workflows or can integrate with incident management systems. They not only raise alerts but also facilitate the assignment of issues to the appropriate teams and track the status until the issues are resolved. Integration with systems like Slack, MS Teams, or Jira ensures that every incident receives prompt attention.
- Proactive recommendations and automation: Based on the integrated telemetry and historical data, some platforms provide actionable recommendations that might include potential changes to data ingestion schedules, adjustments to ETL processes, or even automated correction of minor issues. Automated remediation routines are built in. For example, if a transient data delay is detected, the system might automatically re-trigger the data load or adjust processing priorities to resolve the issue.
- AI and GenAI enhancement: AI- and GenAI-driven capabilities automate complex tasks, such as enabling conversational interfaces where users can ask questions about data health, lineage, or incidents in natural language and receive meaningful responses. The tools use GenAI to suggest or generate data quality rules based on observed patterns, and AI agents to provide continuous data monitoring, adaptive learning of rules, and autonomous identification of issues.
- Cost allocation analysis: These capabilities analyze the underlying cost associated with each dataset, and monitor which teams, departments, or projects are using specific datasets, storage, and compute resources. By correlating data usage with cloud or infrastructure costs, organizations can see how much is being spent on different data assets or pipelines.
Market Description
Data observability has rapidly evolved into a critical foundation of modern data operations. As organizations are increasingly building complex, distributed data ecosystems to power analytics, AI, and real-time decision making, ensuring data quality and reliability is paramount. Data observability solutions have matured to offer a spectrum of capabilities that go well beyond simple monitoring.
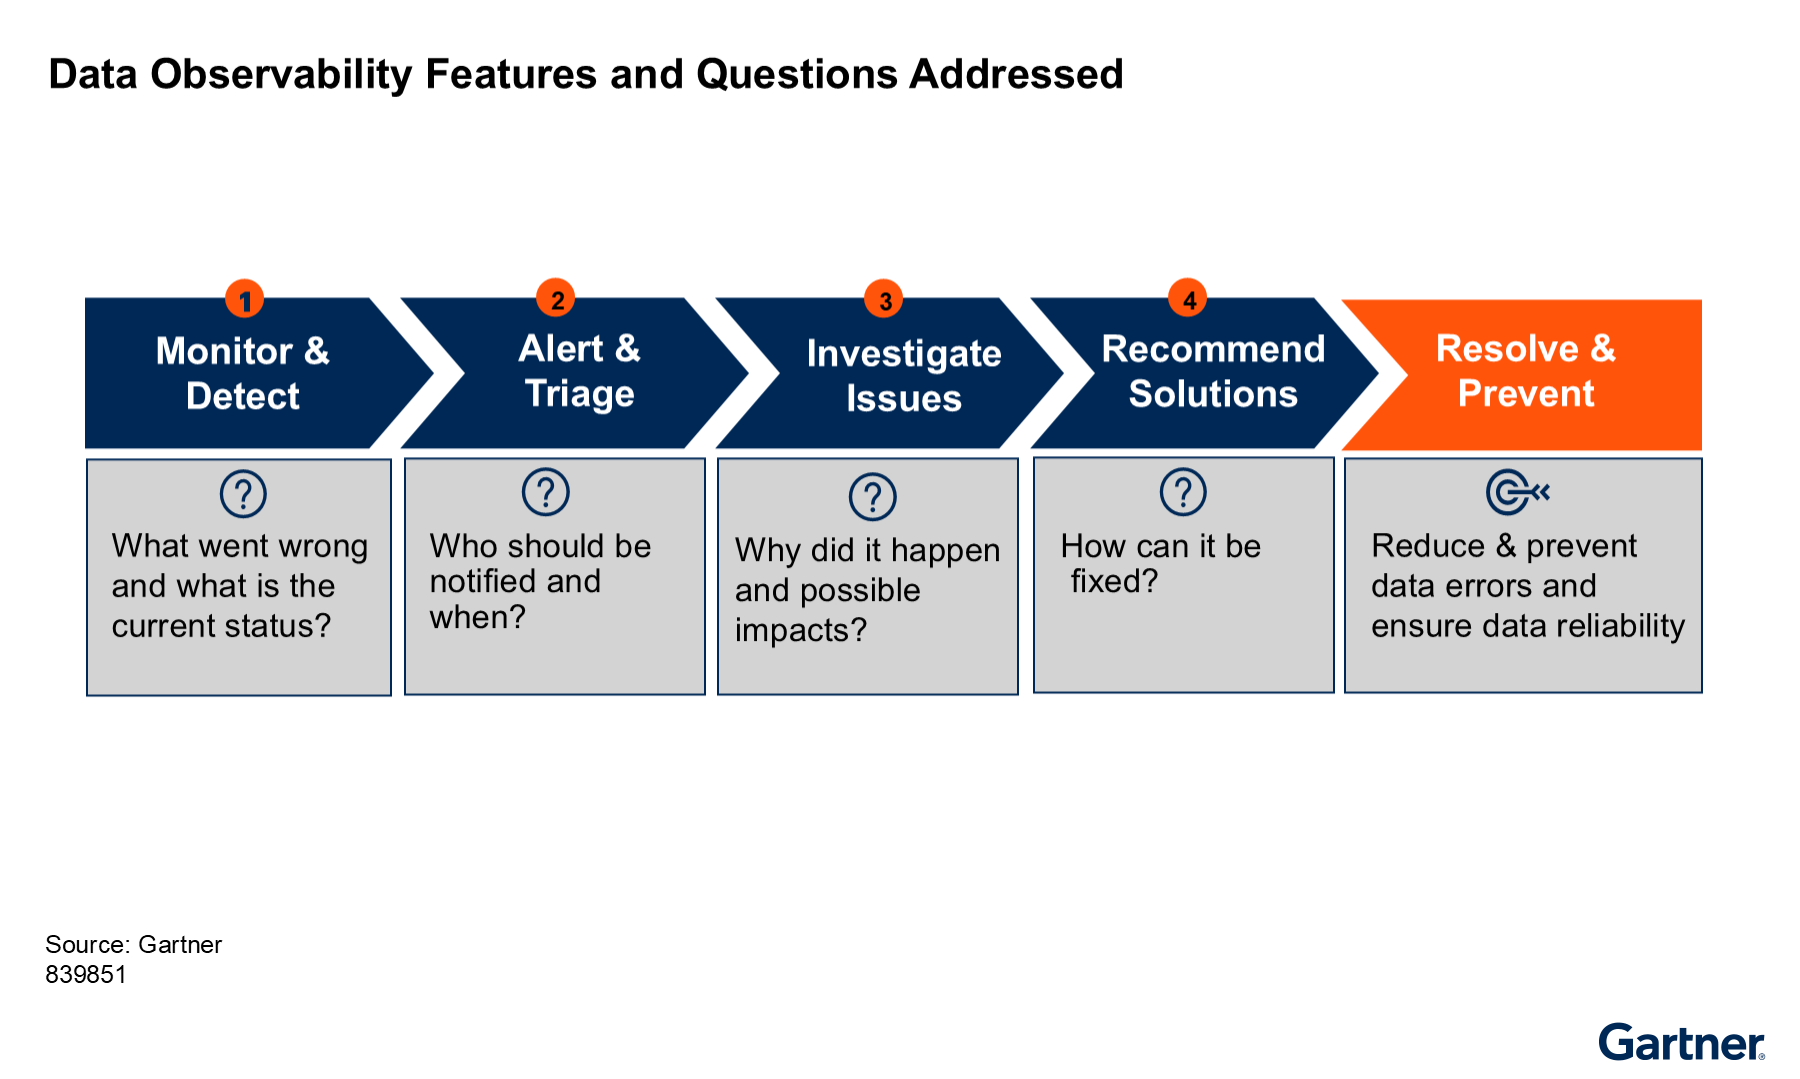
Four Key Data Observability Features
The four key features answer important questions to help D&A leaders understand the health of their data and respond to issues in a timely manner, as shown in Figure 1.
Five Observation Categories
Data observability tools learn what to monitor and provide insights into unforeseen exceptions, focusing on five critical areas (see Figure 2).
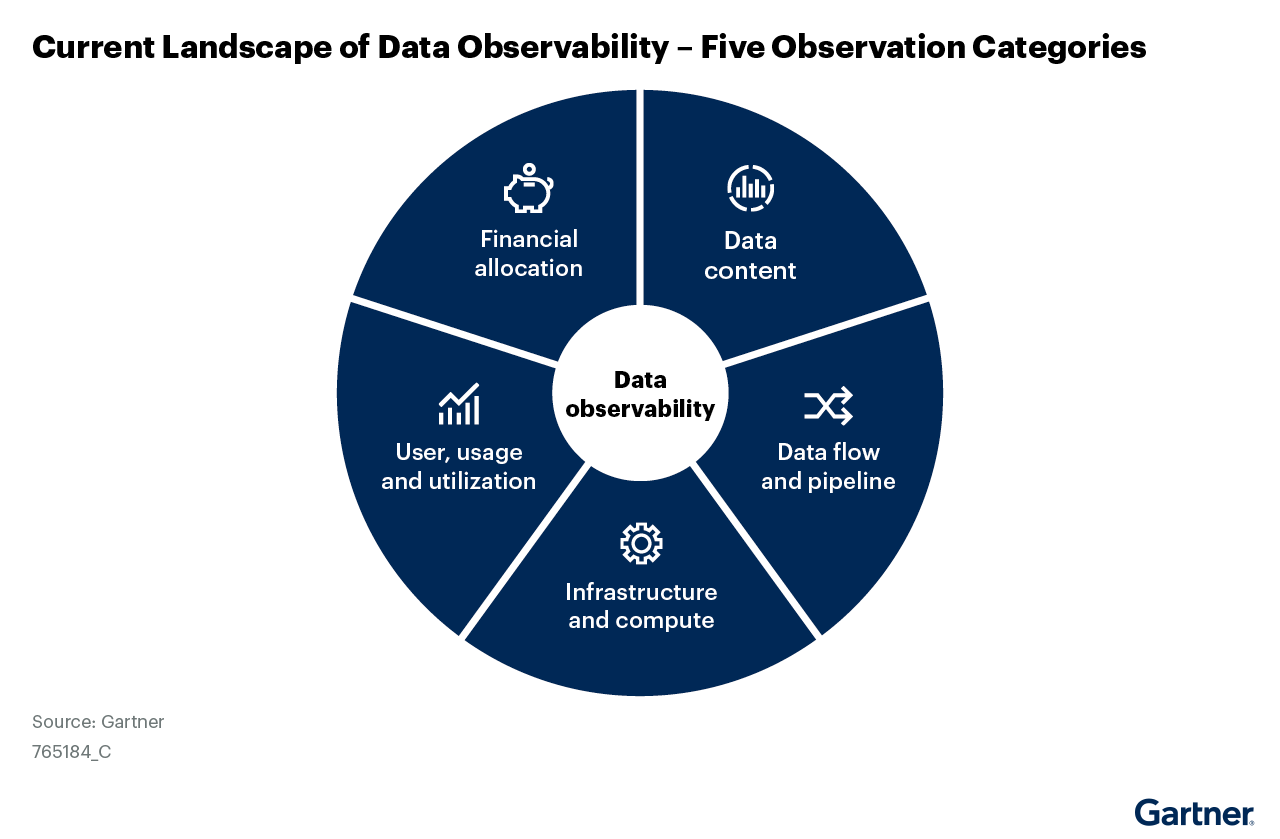
Data content: Ensuring accuracy, completeness, and consistency of the data. Features include:
- Calculating data quality metrics such as completeness, uniqueness and accuracy of data
- Evaluating the statistical distribution of data values, such as median, range, and frequency distributions, to reveal if datasets deviate from expected norms
- Monitoring whether data is up-to-date and delivered within expected timeframes to prevent reliance on stale data
- Tracking record counts and detecting unexpected surges or drops to help identify issues such as data loss or duplication
- Detecting changes in schema, volume and data quality level
- Identifying anomalies, outliers, patterns and violations against business rules
Data flow and pipeline: Monitoring the movement of data through pipelines to detect disruptions or inefficiencies. Features include:
- Monitoring the data pipelines’ components, status, and performance
- Tracing the journey of data from its ingestion through transformations until the final destination with detailed data lineage information
- Tracking job success/failure, retries, runtimes, SLAs, data volumes, and dependency chains
- Checking for drifts in schema, codes or configurations
- Finding bottlenecks, broken pipelines, or failed or incomplete jobs
- Automate recovering or retrying failed jobs
Infrastructure and compute: Ensuring the data ecosystem has sufficient resources. Features include:
- Capturing operational metadata from various sources, such as system logs and trace files
- Verifying that the resource consumption (e.g., compute, performance, storage, network) is below the threshold
- Monitoring and analyzing current and scheduled workload, and forecasting the necessary resources
- Monitoring network latency and bandwidth at point of time to support upcoming data jobs or regular data operation
User, usage and utilization: Understanding how data is accessed and used, including any deviations from typical patterns. Features include:
- Determining who owns, changes and reads the data
- Identifying how often a user accesses specific data
- Assessing the number of queries running against the data, the most frequent query and the total execution time in a certain period
- Tracking how the sensitive data is used through the data pipelines
Cost allocation: Tracking expenditure in cloud computing environments to ensure cost-effective operations. Features include
- Analyzing the underlying cost associated with each dataset
- Analyzing cost attribution by business unit, project, or job run
- Forecasting and anomaly detection for cost trends
- Providing granular cost visibility, automated rightsizing, and predictive financial analytics for chargeback, cost optimization, and resource planning.
Four Key Features and Five Observation Types Bring Comprehensive Coverage
Currently, the data observability market offers these capabilities across five main observation areas as embedded or stand-alone tools, although some tools may not cover all five areas on their own. Table 1 highlights how data observability tools may offer four levels of capability for different observation areas.
Data Observability Features Across Five Observation Categories
Level 1 Monitor and detect | Level 2 Alert and triage | Level 3 Investigate | Level 4 Recommend | |
Data content |
|
|
|
|
Data flow and pipeline |
|
|
|
|
Infrastructure and compute |
|
|
|
|
User, usage and utilization |
|
|
|
|
Cost allocation |
|
|
|
|
Source: Gartner (February 2026)
Market Direction
Technology Evolution and Differentiation
From Monitoring to Observability
Historically, organizations employed traditional monitoring and data quality tools focused on static checks and rule-based validations. These approaches, while effective for earlier and less complex data environments, struggled when data volumes exploded and architectures became more distributed. Data observability emerged over time from the need to understand not only that an event occurred but also why it occurred. This evolution is marked by the incorporation of metadata checks that capture pipeline behavior, data freshness, volume anomalies, and schema drift. Whereas traditional data quality tools executed deep table scans to validate data integrity, observability platforms instead leverage continuous, automated telemetry from metadata and logs. This shift has enabled organizations to achieve a “360-degree-view” of their data ecosystems and quickly remediate anomalous behaviors before they impact critical business functions
Integration of AI and GenAI Technologies
One of the most disruptive developments in the observability market is the integration of AI and generative technologies. The advent of generative AI has expanded the scope of data observability by automating not only the detection but also the remediation of data issues. AI-enabled observability tools now offer capabilities such as:
- Automated anomaly detection: Leveraging machine learning (ML) to learn baseline patterns and dynamically setting thresholds to detect deviations.
- Root cause analysis: AI algorithms that rapidly pinpoint the underlying causes of anomalies, thereby reducing downtime and engineering time.
- Predictive analytics: Forecast potential issues before they adversely affect the system, enabling proactive maintenance.
- Enhanced contextualization: Integration with metadata, lineage, and usage metrics to provide comprehensive operational insights.
- Automated remediation: Automate corrective actions such as rerunning pipelines, applying data fixes or rolling back changes and response to detected issues, reducing mean time to resolution.
For instance, some data observability tools integrate AI-powered anomaly detection with automated root cause analysis, providing actionable insights that drive faster resolution of data incidents. Natural language interfaces and Generative AI enable observability tools to translate complex telemetry into easily understandable text summaries, making insights accessible to both technical and nontechnical stakeholders.
Growth Drivers and Market Dynamics
Rising Demand and Increasing Adoption
The demand for data observability is driven by several factors:
- Rise of AI adoption: Expanding AI workloads demand high-quality data ecosystems. Poor data quality can lead to model drift and operational inefficiencies. Data observability tools imbued with AI/ML capabilities help in automated anomaly detection and predictive alerts to ensure the data is continuously fit for the purpose.
- AI and agentic AI: Increasing AI and agentic AI workloads require continuously assessing data quality, data governance, and context alignment by validating technical and business metadata to guarantee that AI agents consume the right inputs. In generative and agentic AI scenarios, continuous monitoring of semantic drift alerts data teams to subtle shifts before data issues compromise model reliability, introduce bias, or lead an autonomous agent to take undesired actions.
- Data-driven decision making: Businesses across industries are leveraging data analytics, AI, and ML for strategic decision making. Reliable data is a prerequisite to these processes, necessitating robust observability practices.
- Operational resilience: Organizations are increasingly prone to business interruptions caused by data issues. Data observability tools help maintain uptime and service continuity by ensuring that data pipelines operate reliably. With downtime costing millions and inefficiencies driving up costs, enterprises are compelled to invest in tools that lower the mean time to detection (MTTD) and resolution (MTTR).
- Regulatory compliance: Stringent data protection regulations and compliance mandates require organizations to ensure data integrity. As regulations like GDPR, HIPAA, and others require transparent data lineage and consistent quality, data observability tools serve as an indispensable component for auditing and compliance reporting.
- Cost implications and FinOps: Growing awareness of cloud spending inefficiencies has led to a more data-driven approach to financial operations (FinOps), particularly as GenAI and AI agents introduce more dynamic and less predictable consumption patterns. By enabling precise tracking of data flows and resource usage, observability tools help organizations optimize cloud expenditure. Real-time monitoring of data pipelines can identify inefficiencies that may lead to unexpected cost overruns, enabling proactive measures to control spending and improve operational efficiency.
According to Gartner’s 2025 State of AI-ready Data Survey,1 53% of D&A or AI leaders said their organizations have already implemented data observability tools. In addition, 31% of respondents claimed they consider implementing the tools within 6-12 months, and 12% within 12-18 months, underscoring near-term momentum. Also, based on Gartner market share analysis (see Market Share Analysis: Data Management Software (Excluding DBMS), Worldwide, 2024), the overall revenue growth in the data observability market is 20.8% in 2024 and comes to $346.4 million. From these data points, Gartner sees strong growth for data observability adoption in the next few years due to the demand for AI-ready data (see Quick Answer: What Makes Data AI-Ready?).
Consolidation of Monitoring Capabilities
A recurring observation in the market is the fragmentation of data observability functions. Traditionally, different tools addressed aspects of data observability such as data quality, data lineage, and pipeline orchestration, but this often led to siloed solutions that forced data teams to piece together disparate data points. To combat this challenge, there is a notable trend toward consolidating functionalities into unified platforms that cover multiple observation areas:
- Embedded vs. stand-alone solutions: Currently, the data observability market is split between embedded and stand-alone tools with unique capabilities. Some existing tools, such as data quality solutions, DataOps tools, data warehouse platforms and ETL tools, have embraced data observability capabilities and offer them as extensions or embedded features. For example, vendors like Ataccama and Collibra incorporate observability features into their broader data quality or metadata management solutions. At the same time, numerous startup vendors (such as Monte Carlo, Sifflet, and Telmai) provide stand-alone data observability tools as a dedicated offering for end-to-end observations, creating a new market for data observability. Stand-alone tools tend to be specialized, offering deep insights into data monitoring, while embedded solutions offer ease of integration and a unified user interface.
- Data management platforms (DMPs): Traditional data integration and orchestration platforms are increasingly incorporating observability capabilities (see Market Guide for Data Management Platforms). This consolidation reduces vendor sprawl and simplifies procurement, as buyers prefer fewer, integrated systems that can deliver end-to-end data management, provenance, and observability.
Market Analysis
Confusion and Overlap With Other Adjacent Tools
Data Observability Tools vs. Data Quality Solutions
People often look at data observability primarily through the lens of data quality and see them both as interchangeable terms. While they are similar and have overlapping areas, data quality and observability are very different concepts.
For example, data quality is concerned with data itself from a business context, while data observability has additional interests and concerns the system and environment that deliver that data. Data quality provides data remediation capability and helps fix data issues, whereas data observability offers monitoring and observation as a baseline and may provide recommendations to fix the issue and even predict potential issues.
However, it is rare to automatically execute recommendations in data observability tools. Users need to use other mechanisms to execute the recommendations or resolve issues. These two technologies (data observability and data quality) overlap in the following technical capabilities:
- Data profiling
- Data quality/data content monitoring
- Metadata management
- Data lineage
Combining Data Observability With Data Quality
In recent years, some data quality vendors include additional observability features in their products — such as observing data content and flow. This trend among data quality vendors is because data quality and observability can work together to improve the insights gleaned from the collected data. Data and analytics leaders looking to gain the most value from their organization’s data need to maximize both data quality and data observability. For more details on data quality market offerings, refer to Gartner’s Magic Quadrant for Augmented Data Quality Solutions.
Data Observability Tools vs. Observability Platforms
Data observability tools are also often confused with general observability tools that are typically related to application performance monitoring (APM) tools. APM and observability tools are powerful analytics platforms that ingest multiple telemetry feeds and provide critical insight into application health, performance and, increasingly, security. They are not intended to monitor the data or anything associated with data (see Quick Answer: What Is the Difference Between Observability and Data Observability?). However, APM tools and data observability tools have a common interest in monitoring infrastructure resources. For more details about the current APM and general observability tools market, refer to Magic Quadrant for Observability Platforms.
Data Observability Tools vs. DataOps Tools
Data observability and DataOps tools are increasingly shortlisted together as organizations decide whether to prioritize pipeline execution or holistic data health as their first‑order operational concern. While capabilities continue to converge, the distinction is driven significantly by focus.
DataOps platforms center on automating, orchestrating, and operating data pipelines and workflows across ETL and ELT processes. Organizations that prioritize pipeline efficiency, deployment velocity, and engineering productivity typically lead with DataOps. Data observability platforms place the data itself at the center, emphasizing continuous qualification of data health, lineage context, and downstream impact across pipelines.
In practice, modern DataOps tools embed data observability signals, while data observability platforms consume pipeline telemetry to assess data fitness and governance risk. The key decision is therefore whether accountability is anchored in pipeline operations or in overall data visibility. These two technologies (data observability and DataOps) overlap in the following technical capabilities:
- Pipeline and job monitoring
- Data freshness, volume, and schema validation
- Operational metadata and lineage collection
- Data health and rule‑based validation checks
The distinction between DataOps and data observability is primarily influenced by where organizations place their current operational emphasis within the data life cycle. DataOps addresses the execution and management of data workflows, while data observability emphasizes continuous visibility into data health, behavior, and context across pipelines and environments. Data and analytics leaders should evaluate how these perspectives align with their operating model, ownership structures, development teams, and governance needs when determining how the two capabilities are applied.
Broader Integration for Holistic Visibility and Operational Efficiency
Data observability is not solely about passive monitoring of data pipelines; it involves actively managing data quality, lineage, and performance across the entire data landscape. To achieve this, data observability platforms connect to diverse tools and systems throughout the data ecosystem. Integrating other tools enables data observability tools to provide end-to-end visibility, automate responses, enhance collaboration, and ensure data reliability across the entire data ecosystem. The integrations can be broadly grouped into the following categories:
- Data integration, orchestration, and pipeline tools (e.g., Apache Airflow, dbt)
- Data catalog or metadata management solutions (e.g., Alation, Atlan)
- IT service management (ITSM) platforms or incident management tools (e.g., ServiceNow, PagerDuty)
- Data quality solutions or D&A governance platforms (e.g., Collibra, Informatica)
- BI & analytics tools (e.g., Tableau, Microsoft Power BI)
- Messaging systems (e.g., Slack, MS Teams, ServiceNow, Jira)
- Security or identity and access management (IAM) tools (e.g., Okta, AWS SSO)
Pricing Models and TCO Considerations
Pricing strategies in the data observability market have evolved given the varied nature of the deployment models and expected data volumes. Key pricing trends include:
- Volume-based pricing or consumption-based pricing: Many vendors charge based on the volume of data ingested, the number of tables/columns monitored, or the number of alerts generated. This model directly links costs to data pipeline scale and can impact TCO. For large enterprises with vast data flows, careful cost management is necessary.
- Tiered and subscription-based models: Vendors also offer tiered subscription plans tailored to different requirements and organizational sizes — from single-user licenses to enterprisewide deployments. The factors that contribute to different tiers include the number of tables monitored, pipelines and jobs monitored, product features, deployment options, and source systems to connect. These plans cater to both established enterprises and SMEs, as well as various demand scenarios.
- Managed services versus self-hosted solutions: Managed observability platforms often come with higher operational costs but relieve organizations from the complexities of maintaining infrastructure. Alternatively, self-hosted open-source platforms (e.g., using OpenTelemetry-based toolkits) offer cost advantages but require significant internal expertise and resource commitment.
Representative Vendors
The vendors listed in this Market Guide do not imply an exhaustive list. This section is intended to provide more understanding of the market and its offerings.
Vendor Selection
The following Table 2 lists the vendors that cover at least one of the observation areas outlined in this guide. It includes both embedded and stand-alone data observability tools, based on the top 20 vendors of interest through Gartner client inquiries. The table also highlights vendors’ current observability coverage. Please note the vendors’ coverage information is based on Gartner’s best knowledge through the vendor’s public information and additional information submitted by vendors at the time of research. The information listed may have changed when this guide is referred to. For the latest information, please check with the vendors.
Representative Vendors in Data Observability Tools
Vendor | Product Name | Data Content | Data Pipeline | Data Infrastructure | Data Lineage | Cost Allocation |
Acceldata | Acceldata Data Observability Cloud; Agentic Data Management | X | X | X | X | X |
Anomalo | Anomalo Platform | X | X | X | X | X |
Ataccama | Ataccama ONE | X | X | X | ||
Bigeye | Bigeye Data Observability | X | X | X | ||
Collibra | Collibra Data Quality & Observability | X | X | X | ||
Datadog | Database Monitoring; Data Streams Monitoring; Quality Monitoring; Jobs Monitoring | X | X | X | X | X |
Datagaps | Datagaps DataOps Suite — Data Quality Monitor | X | X | X | ||
DQLabs | DQLabs Platform; Prizm by DQLabs | X | X | X | X | X |
Elementary Data | Elementary Cloud Platform | X | X | X | ||
IBM | IBM Data Observability | X | X | X | X | X |
Monte Carlo | Monte Carlo | X | X | X | X | X |
Precisely | Data Integrity Suite | X | X | |||
Revefi | Data Operations Cloud | X | X | X | X | X |
Saturam | Qualdo-DRX | X | X | X | ||
SelectZero | SelectZero | X | X | X | ||
Sifflet | Sifflet | X | X | X | X | |
Soda | Soda Cloud | X | X | X | ||
Telmai | Telmai | X | X | X | ||
Unravel | Unravel Data Observability and FinOps Platform | X | X | X | X | X |
Validio | Validio | X | X | X | X | X |
Source: Gartner (February 2026)
Vendor Profiles
Acceldata
Acceldata is headquartered in California, U.S. Its data observability products include Acceldata Data Observability Cloud (ADOC) and Agentic Data Management (ADM), which is built on the foundation of ADOC. Acceldata provides a broad range of native connectivity across modern data ecosystems, including cloud data warehouses and data lakes, on-premises databases, streaming data sources, and file/object storage. It supports both structured and semistructured data.
ADOC can support data content observability by calculating common data quality metrics (e.g., completeness, uniqueness, validity, range, referential integrity) and statistical profiling such as distributions, cardinality, and outlier detection. ADOC offers ML-driven anomaly detection and adaptive baselines to identify unexpected changes in data values, patterns, schema, volume, and quality over time. It also tracks job success/failure, retries, runtimes, SLAs, data volumes, and dependency chains, making it easy to spot bottlenecks or incomplete jobs.
ADOC includes an infrastructure observability module that monitors compute, memory, storage, and key performance indicators for modern data platforms. It captures cluster/node utilization, CPU, memory, disk I/O, storage growth, and queue/backlog metrics. It analyzes compute, storage, and query/pipeline costs at granular levels (dataset, table, job, user, project) and attributes spend to business units or projects using tags, schemas, and metadata. These features are available for both Snowflake and Databricks environments. ADOC uses time-series analysis and anomaly detection to spot unexpected cost spikes or trend changes. Its predictive models help forecast spend under different workload patterns.
Acceldata currently supports all five observation categories.
Deployment options: Public cloud/multicloud, on-premises, SaaS, hybrid, VPC/private cloud, containers-based
Integration examples: Airflow; Atlan; Databricks Workflows; dbt; Jira; Microsoft Teams; ServiceNow; Slack
Pricing and license models: Tiered pricing (based on deployment scope and policy executions), trial version
Anomalo
Anomalo is headquartered in California, U.S. Its data observability product is Anomalo Platform. The platform offers native integrations with major cloud data environments, such as Snowflake, BigQuery, Databricks, and Redshift, as well as on-premises relational databases.
Anomalo uses unsupervised ML approaches to learn what normal looks like for the data. This feature allows the platform to learn the historical patterns of data in a table without requiring any manually defined rules or thresholds. The platform then automatically detects deviations from these learned patterns, alerting users to possible anomalies, quality issues, or unexpected changes in data structure and volume.
Anomalo can monitor compute utilization and execution characteristics by analyzing system tables and query history exposed by cloud data platforms such as Snowflake and Databricks. This allows Anomalo to detect anomalies related to query runtimes, warehouse scaling behavior, and workload contention. Anomalo can also analyze and report on cost attribution by business unit or project when customers use table labels to represent ownership or cost centers. By monitoring warehouse usage and cost system tables in combination with these labels, Anomalo can associate query activity and dataset-level cost signals with business units or projects and provide analysis, monitoring, and alerts.
Anomalo currently provides data content observability, data pipeline observability, and data lineage, with limited support in infrastructure and cost allocation observabilities.
Deployment options: Public cloud/multicloud, on-premises, SaaS, hybrid, VPC/private cloud, containers-based, Snowflake Snowpark Container Services
Integration examples: Airflow; Alation; Collibra; Google SSO; Jira; Okta; Power BI; ServiceNow; Slack; Tableau
Pricing and license models: Tiered pricing (based on product features, number of data assets monitored, deployment model [SaaS, hybrid, in-VPC], support level), trial version
Ataccama
Ataccama is headquartered in Boston, U.S. Its data observability product is part of the Ataccama One suite and is integrated with other features like data quality, data catalog, and data governance in the same platform. Ataccama provides a wide range of connectors to data environments across all major cloud ecosystems, on-premises databases, Hadoop, and streaming data sources. All out-of-the-box connectors are included in the license with no additional charge.
Ataccama provides data content monitoring and detection and streamlined processes to address issues. Customers can define granular data quality metrics (such as completeness, uniqueness, validity, and accuracy) and apply them across selected data assets, source systems, and data pipelines. Metrics can be calculated in real time within pipelines, as well as in batch for data at rest. Anomalies and outliers can be identified in real time to detect unexpected changes in data values, schema modifications, and sudden drops in data volume. When anomalies are detected, the platform immediately generates actionable alerts through multiple message channels enabling immediate response and resolution.
The AI chatbot “One AI” helps to define rule descriptions, generate rule logic, and create test data for validation. The platform monitors individual steps within data pipelines to identify failures and execution issues. Pipeline performance, including detection of failures and abnormal behavior, is monitored at the job level. Data lineage is natively available and tightly integrated with data observability.
Ataccama currently supports data content observability, data pipeline observability, and data lineage.
Deployment options: Public/multicloud, on-premises, SaaS, hybrid, VPC/private cloud, containers-based
Integration examples: Atlan, Collibra, dbt, Airflow, ServiceNow, Jira, Tableau, Power BI, Azure AD, Okta
Pricing and license models: Tiered pricing (based on number of power users, data assets monitored, and compute consumption), trial version, and freemium (Snowflake Marketplace only)
Bigeye
Bigeye is headquartered in San Francisco, U.S. Its data observability product is Bigeye Data Observability. Bigeye integrates natively with popular cloud data platforms (e.g., Snowflake, Databricks, Google BigQuery, and Amazon Redshift, as well as on-premises environments (e.g., SQL Server, Oracle, Teradata, SAP), legacy ETL (e.g., Microsoft SSIS, Informatica Powercenter, Qlik Replicate), and mainframe systems. Bigeye can monitor and run data quality checks on semistructured fields (e.g., nested JSON, structs, blobs) as long as a SQL query engine is available for the data sources.
Bigeye evaluates metrics such as data freshness, volume, schema changes, and distribution shifts. Its real-time monitoring approach ensures that anomalies are flagged promptly, preventing cascading errors in downstream applications. Bigeye centralizes monitoring metrics in a dedicated metric store, supporting custom metrics and historical baselining. bigAI, an AI-powered suite of features embedded in the tool, automatically investigates data anomalies, generates human-readable summaries of incidents, and suggests actionable remediation steps.
Bigeye has extended its functionality by launching its Enterprise AI Trust Platform to monitor and enforce data quality standards before data is ingested by AI models. This addition addresses the growing need for AI governance, sensitive data scanning for agentic AI, and data reliability.
Bigeye currently supports data content observability, data pipeline observability and data lineage.
Deployment options: Public/multicloud, on-premises, SaaS, hybrid, VPC/private cloud, containers-based
Integration examples: Airflow; Alation; Atlan; DataGalaxy; dbt; Jira; Power BI; ServiceNow; Slack; Tableau
Pricing and license models: Tiered pricing (based on number of data assets monitored, and number of data sources connected)
Collibra
Collibra is headquartered in both New York, U.S, and Brussels, Belgium. Its data observability product is Collibra Data Quality & Observability (DQ&O), which is offered in two models: stand-alone with self-hosted, and a SaaS model natively built into the Collibra Platform. The SaaS version has most of the observability capabilities the self-hosted version has, and more parity is planned for later this year, including native pipeline observability for Airflow and dbt. Collibra DQ&O offers connectivity to cloud data warehouses and databases, on-premises data sources and cloud-based business applications such as Salesforce, and SAP S/4HANA.
Collibra automates data quality analysis using a set of profiling techniques, including statistical, pattern-based, and semantic methods. For example, the tool performs statistical analysis by calculating key metrics such as mean, median, or cardinality. These statistical results are visualized using histograms and correlation charts. Collibra provides adaptive anomaly detection by learning the expected behavior of data via statistical analysis. This baseline is then used to automatically generate data quality rules and alert users to anomalies and unexpected changes, which eliminates the need for manually configured thresholds.
The platform also offers root-cause and impact clarity through automated column-level lineage that spans from source databases to BI tools; these insights are powered by a knowledge graph that aggregates health scores (e.g., timeliness, completeness) across the entire data and semantic hierarchy. Collibra also offers remediation workflows in the Collibra Platform with task assignment for faster resolution, accountability, auditing, and reporting.
Collibra currently supports data content observability, data pipeline observability, and data lineage.
Deployment options: Public/multicloud, on-premises, SaaS, hybrid, VPC/private cloud, containers-based
Integration examples: Azure Data Factory; dbt; Matillion; Microsoft Teams; Power BI; Slack; Tableau
Pricing and license models: Tiered pricing (based on product features, number of data assets monitored), trial version (through Collibra’s professional services’ accelerate program)
Datadog
Datadog is headquartered in New York, U.S. Its data observability products include Data Observability: Quality, Data Observability: Jobs, Data Streams Monitoring and Database Monitoring. These products are sold with different SKUs. Datadog offers a unified suite of monitoring, tracing, and analytics tools that span across infrastructure, applications, logs, security, and data observability. Datadog not only monitors system performance metrics such as latency, error rates, and throughput but also provides features for data quality monitoring, pipeline observability, database monitoring, cost management, and integration with open standards like OpenTelemetry and OpenLineage.
Datadog offers extensive data pipeline observability over DevOps toolchains and CI/CD pipelines. It integrates data observability into development workflows, such as triggering live debugging sessions or integrating incident data into on-call management systems, to ensure that data teams can react to performance degradations. The tools can also aggregate logs from data pipeline tools and infrastructure to troubleshoot issues or analyze the job performance. Datadog can automatically trigger alerts when log patterns indicate data pipeline failures or anomalies.
Furthermore, Datadog offers granular insights into resource usage across AWS, Azure, and GCP. This enables data teams to link performance metrics directly to cost, thereby optimizing cluster configurations, rebalancing workloads, and ultimately reducing the financial overhead.
Datadog currently supports all five observation categories.
Deployment options: Public/multicloud, on-premises, SaaS, hybrid, VPC/private cloud, containers-based
Integration examples: Airflow; dbt; Jira; Looker; Microsoft Teams; PageDuty; Power BI; ServiceNow; Spark; Tableau
Pricing and license models: Tiered and modular pricing (based on product features, number of data assets monitored, compute resources supporting each data environment), trial version (14 days)
Datagaps
Datagaps is headquartered in Virginia, U.S. Its data observability tool is the Data Quality Monitor. Rather than a stand-alone tool, Data Quality Monitor is an integrated component within the broader Datagaps DataOps Suite, enabling observability of data pipelines across modern architectures.
Datagaps uses Apache Spark as an engine and connects to common enterprise data sources (e.g., relational databases, data warehouses, data lakes, NoSQL, and streaming datasources). Once connected, Datagaps executes data profiling, rule checks, and reconciliation tests across environments to support use cases such as migration validation and production monitoring. Datagaps features validating data where it resides. This enables local data quality checks for completeness, uniqueness, distribution drift, and transformation correctness, as well as large-scale source-to-target reconciliation for migration and regression testing.
Datagaps supports monitoring pipeline execution through repeatable runs, status tracking, and evidence-based validation outputs. Users can see whether validations executed successfully, review run histories, and correlate failures with specific datasets and checks. While Datagaps is not positioned as a full infrastructure APM tool, it does provide operational signals such as run outcomes and execution timing that help identify where pipeline steps are failing or slowing. In addition, Datagaps validates the produced data (not just job completion), enabling teams to catch “successful job, wrong data” scenarios that traditional pipeline status checks may miss.
Datagaps currently supports data content observability, data pipeline observability and data lineage. It does not offer a SaaS deployment option.
Deployment options: On-premises, public cloud (customer-managed), hybrid, VPC/private cloud, containers-based
Integration examples: Alation; Collibra; Jira; Okta; Oracle Analytics; Power BI; Tableau
Pricing and license models: Tiered pricing (based on number of power users, product features, additional repository/server installation, specific automation extensibility usage), trial version (14 days initially and another 14-day extension)
DQLabs
DQLabs is headquartered in California, U.S. Its data observability tool is an integrated component of the overall platforms (DQLabs Platform, and Prizm by DQLabs). The vendor provides an integrated platform that unifies data observability with data quality, supported by agentic AI and semantics. The platform offers a wide range of connectivity to various data systems across cloud, on-premises, and streaming data sources.
DQLabs uses rule-based and ML-driven analysis to identify anomalies, outliers, distribution shifts, and rule violations. It also supports pattern detection and threshold-based and behavioral monitoring. In addition, the tool also monitors pipeline components and execution status, including run state, duration, throughput, and data movement metrics across ingestion, transformation, and consumption layers.
The platform can capture resource usage and cost observability. This includes performance metrics related to query execution times, resource consumption (e.g., CPU, memory), and cost allocation. The alerting and reporting mechanisms enable enterprises to conduct budget planning and chargeback or FinOps operations more efficiently.
DQLabs currently supports all five observation categories.
Deployment options: Public cloud/multicloud, on-premises, SaaS, hybrid, VPC/private cloud, containers-based
Integration examples: Airflow; Alation; Atlan; Coalesce; Collibra; dbt; Microsoft Teams; ServiceNow; Slack; Talend
Pricing and license models: Tiered pricing (based on product features, data environments to be connected or connectors to be used)
Elementary Data
Elementary Data is headquartered in Tel Aviv, Israel. Its data observability tool is its Elementary Cloud Platform. Its design is tailored for data and analytics engineers working predominantly in code-centric environments (dbt, Python, etc.). The platform integrates into existing workflows such as dbt pipelines, ensuring that data quality monitors, lineage reporting, and automated test coverage are embedded directly into the code versioning and deployment pipelines. Elementary’s AI agents offer automation of engineering tasks. For example, its triage AI agent conducts root cause analysis and suggests remediation actions. If connected to code repository and orchestrator, the agent can automatically re-run the job or open a pull request to fix issues
Elementary Data can also integrate with various components of the modern data stack, including data warehouses such as Snowflake, BigQuery, Redshift, Databricks, and PostgreSQL, as well as BI platforms like Tableau and Looker. The product includes open-source and self-hosted SDKs, as well as the cloud platform (which is the commercial version), with features like advanced alerting, AI agents, column-level lineage, collaboration, and support.
Elementary Data does not specifically provide data infrastructure and cost observability. However, Elementary offers a cost optimization agent that analyzes the jobs and pipelines, and detects opportunities for optimization.
Elementary Data currently supports data content observability, data pipeline observability, and data lineage.
Deployment options: Public cloud/multicloud, on-premises, SaaS, hybrid, VPC/private cloud, containers-based
Integration examples: Airflow; Atlan; Collibra; Fivetran; Github; Jira; Looker; Matillion; Slack; Tableau
Pricing and license models: Tiered pricing (based on number of power users, product features, data environments to be connected or connectors to be used), trial version, open-source version
IBM
IBM is headquartered in New York, U.S. Its primary data observability tool is IBM Data Observability through the acquisition of Databand. IBM Data Observability is offered both as a separate SKU and as an embedded product capability in IBM watsonx.data integration. Other IBM product families, such as IBM watsonx.data intelligence, IBM Apptio, and IBM Instana, also provide some observability capabilities which complement closely with IBM Data Observability.
IBM Data Observability provides comprehensive monitoring and detection capabilities for cloud-based data warehouses, enabling organizations to maintain the health and reliability of their data pipelines. The solution offers out-of-the-box integrations with data platform ecosystems, as well as code-based integrations with frameworks like Python and Apache Spark. The product tracks pipeline-level execution (state, duration) and granular task/activity-level metrics including operator execution, input/output data, logs, and errors.
IBM Data Observability supports infrastructure monitoring, including monitoring compute and resource allocation via the custom integration with OpenLineage. This can be extended into a complete view of application observability when used in coordination with IBM Instana. The tool can also integrate with IBM Apptio for more specific cost-allocation monitoring. IBM Apptio’s FinOps capabilities can show IT spend by business units and users through automated showback and chargeback mechanisms; it also provides defensible justification of charges, ensuring predictable IT allocations.
IBM currently supports all five observation categories.
Deployment options: Public/multicloud (IBM Cloud and AWS), on-premises, SaaS (IBM Cloud and AWS), hybrid, VPC/private cloud, containers-based
Integration examples: Airflow; Azure Data Factory; dbt; email; Microsoft Teams; PagerDuty; Slack
Pricing and license models: Tiered pricing (based on number of the jobs or pipelines, resource consumption), trial version
Monte Carlo
Monte Carlo is headquartered in California, U.S. Its data observability tool is the Monte Carlo Data + AI Observability platform, sold as a stand-alone, SaaS solution that can also be delivered as a hybrid setup within a customer’s virtual private cloud. Monte Carlo provides connectivity to mainstream cloud data lakes, cloud data warehouses and streaming data sources such as Kafka. It also supports on-premises environments by setting up egress-only agents running locally for queries and check execution without pulling entire datasets.
Monte Carlo’s tool can detect anomalies and data quality rule violations using ML algorithms that automatically learn baseline patterns across more than 60 key metrics such as freshness, volume, schema, and distribution This can be done using a simple no-code UI as well as its AI agent workflows. Job monitors can be set to alert pipeline failures in ETL tools. Monte Carlo also surfaces the performance and duration of the underlying tasks to monitor pipeline health, including failure rates.
Monte Carlo’s observability framework extends into monitoring AI workloads as well, including drift detection for model inputs (freshness, quality, etc.) and outputs (task completion, relevance, etc.). Monte Carlo’s platform enhances usability by allowing users to interact with its Troubleshooting Agent and Monitoring Agent. The Troubleshooting Agent enables users to begin automated root cause analysis from an alert page within the UI or Slack and continue with conversational investigation, while the Monitoring Agent recommends monitors for a selected asset.
Monte Carlo currently supports all five observation categories.
Deployment options: Public cloud/Multicloud, SaaS, private cloud, containers-based
Integration examples: Airflow; Alation; Atlan; Collibra; dbt; Fivetran; Jira; Looker; Slack; Tableau
Pricing and license models: Tiered pricing (based on monitor category, deployment scale, and hosting model)
Precisely
Precisely is headquartered in Massachusetts, U.S. Its data observability tool is an integrated component of the overall Precisely Data Integrity Suite. This data observability tool can be sold as a separate module. Precisely provides connectors to widely adopted technologies such as Snowflake, Databricks, Google BigQuery, and Microsoft Azure. The vendor also offers APIs and SDKs that enable integration with various data sources, ETL tools, data warehouses, and cloud platforms.
Precisely’s observability tool offers continuous measurement and monitoring of data health. This is realized through the collection of key metrics that include data ingestion, transformation, and delivery phases. The consistent monitoring ensures issues are detected as soon as they arise.
The tool includes real-time alerts. Key features include threshold-based alerts, where users can define thresholds based on historical data or business-defined metrics. When data deviates from these expectations, an alert is triggered. Alerts are accompanied by contextual information drawn from lineage, metadata, and historical performance. This context allows data engineers to understand the potential impact immediately. In some cases, the system can recommend potential resolutions based on similar historical data issues.
Precisely currently supports data content observability and data lineage.
Deployment options: SaaS, containers-based
Integration examples: Confluent; ServiceNow; Splunk; Tableau
Pricing and license models: Tiered pricing (based on number of data assets monitored)
Revefi
Revefi is headquartered in Washington, U.S. Its data observability tool is the Data Operations Cloud, which integrates data quality monitoring, usage analytics, performance optimization, and cost management into an unified platform. The tool offers out-of-the-box connectors for popular data warehouses (Snowflake, Databricks, BigQuery, Redshift, Postgres), ETL tools, and BI platforms across cloud and on-premises environments. It provides continuous tracking of data freshness, volume, schema changes, and data lineage, as well as alerts for anomalies, missing data, or unexpected changes.
By correlating data from various telemetry sources (logs, metrics, and traces), the tool can quickly isolate the exact point in the data pipeline where issues occur. It also analyzes possible impacts to understand which dashboards, reports, or teams are affected. This reduces the manual investigation time, enabling rapid remediation.
With integrated cost monitoring and optimization tools, Revefi helps organizations maintain control over their cloud data warehouse expenditures. The platform’s ability to precisely track resource usage and suggest adjustments allows businesses to reduce waste, ensure efficient resource allocation, and realize cost savings. Additionally, Revefi leverages AI capabilities from OpenAI, Google Gemini and Anthropic Claude to augment and extend its capabilities.
Revefi currently supports all five observation categories.
Deployment options: Public cloud/Multicloud, SaaS, VPC/private cloud, containers-based
Integration examples: Airflow; Alation; Atlan; dbt; Jira; Looker; Pager Duty; Power BI; Slack; ThoughtSpot
Pricing and license models: Tiered pricing (based on number of power users, product features, data assets monitored, data environments to be connected or connectors to be used), trial version
Saturam
Saturam is headquartered in California, U.S. Its data observability tool is Qualdo-DRX, which supports data sources in hybrid infrastructures, including cloud-native environments and on-premises SQL databases. Qualdo-DRX continuously captures metadata across the ETL/ELT journey, including ingestion, transformation, loading, and consumption, and then synthesizes this data into a unified layer enabling real-time monitoring through automated dashboarding and alerting frameworks.
The platform utilizes a semantic foundation that layers business-critical context and domain-specific intelligence over standard validations. This foundation ensures that data doesn’t just meet technical checks (such as data freshness, consistency, integrity etc.) but also extends data observability to include strategic business KPIs. Its AI-powered engine applies contextual logic and domain expertise to provide end-to-end visibility with integrated column-level lineage, allowing for precise impact analysis and root-cause identification as data flows through the ecosystem.
Qualdo-DRX moves away from rule-based checks and leverages domain intelligence to provide full visibility of business contextual reliability. At every stage of the data point, the tool catches the high-stakes nuanced errors that go beyond standard rules such as required fields or acceptable ranges, thereby improving not only data quality but also data utility. It also leverages historical trend analysis to forecast potential anomalies. It empowers users to optimize pipeline configurations and data processing strategies with predictive incident management before downstream impacts occur.
Saturam currently supports data content observability, data pipeline observability and data lineage.
Deployment options: Public cloud/multicloud, SaaS, VPC/private cloud, containers-based
Integration examples: Airflow; AWS Athena; AWS Glue; Azure Data Factory; Azure Synapse; Databricks Unity Catalog; dbt; Power BI; Synapse
Pricing and license models: Tiered pricing (based on product features, data assets monitored, data environments to be connected or connectors to be used), trial version
SelectZero
SelectZero is headquartered in Tallinn, Estonia. Its data observability tool is SelectZero, which combines data observability with data quality management and data catalog. The platform supports common data warehouses and databases, including Apache Hive, BigQuery, Databricks, Redshift, Snowflake, and Teradata. It also connects to traditional databases such as Microsoft SQL Server, Oracle, and PostgreSQL.
The platform validates and monitors data quality and continuously monitors the health of the data pipelines. It runs SQL-based quality checks and predefined validation rules across various dimensions such as accuracy, completeness, consistency, and timeliness. The platform tracks detailed metadata, offering insights into data characteristics. This includes tracking metrics related to data freshness, volume, schema consistency, and distribution. Such details help in establishing historical baselines that are invaluable when detecting deviations from normal behavior.
SelectZero also triggers alerts and provides insights for possible solutions when anomalies are detected. This capability allows data teams to quickly understand potential root causes and identify corrective measures, further enhancing operational efficiency. The platform has a built-in data catalog with metadata, quality metrics, lineage, and glossary integration, and supports metadata exchange through external imports and APIs.
SelectZero currently supports data content observability, data pipeline observability and data lineage.
Deployment options: Public cloud/multicloud, on-premises, SaaS, VPC/private cloud, containers-based
Integration examples: Active Directory; Jira; LDAP; Microsoft Teams; Power BI; Slack; Tableau
Pricing and license models: Tiered pricing (based on number of power users, product features, data assets monitored, additional instances/installation), trial version (for 30 days)
Sifflet
Sifflet is headquartered in Paris, France. Its data observability tool is Sifflet. Sifflet is a stand-alone data observability platform which provides integrated data cataloging, dynamic monitoring, data lineage tracking, and AI agents to automate incident management from detection to resolution. The tool connects to a broad range of modern cloud data environments, such as Snowflake and Databricks. The Sifflet Agent, a lightweight service, can run inside firewall and query data sources such as MySQL, Oracle, and PostgreSQL, and pushes metadata to the Sifflet platform via outgoing HTTPS without opening inbound ports.
Sifflet recently introduced various AI agents. For example, Sentinel (a monitoring agent) automatically reviews metadata, assesses data quality patterns, and recommends the creation of specific monitoring checks. Sage (an investigation agent) continues with performing immediate root cause analysis once an anomaly is detected. It leverages data lineage, historical incident data, and contextual metadata to trace an issue back to its origin. Forge (a resolution agent) offers actionable recommendations for remediation, based on the insights provided by Sage. It can even execute automated actions, such as retrying failed jobs, triggering backfill processes, or restarting pipelines, all while incorporating human approval gates for safety.
The Sifflet Native App for Snowflake is designed to query the Snowflake database and retrieve information on usage and costs, which allows for monitoring the cost footprint and resource consumption of Snowflake assets. The similar features are not available for other data environments.
Sifflet currently provides data content observability, data pipeline observability, and data lineage, with limited support in cost allocation observability.
Deployment options: Public cloud/multicloud, on-premises, SaaS, hybrid, VPC/private cloud, containers-based, Snowflake Native App
Integration examples: Airflow; dbt; Fivetran; MicroStrategy; Qlik; Slack; Tableau
Pricing and license models: Tiered pricing (based on product features, data assets monitored, early access to new features)
Soda
Soda is headquartered in Brussels, Belgium. Its data observability tools are Soda Core and Soda Cloud. Soda Core, an open-source product, is a command-line tool that enables users to write, version, and execute data contracts using a domain-specific language known as Soda Contract Language. Soda Cloud, as a commercial data observability platform, builds on the testing and monitoring capabilities of Soda Core and adds additional features to support data observability for data operation purposes.
Soda Cloud offers integrations with popular data warehouses and processing platforms like Databricks, Snowflake, BigQuery, and Redshift. It operates within CI/CD pipelines and workflow orchestrators (e.g., Airflow, dbt). The tool calculates data quality metrics, including completeness, uniqueness, validity, freshness, volume, and distributions, and performs continuous statistical profiling and monitoring using both deterministic rules and adaptive models. It also automatically detects schema changes, volume growth or drops, freshness issues, and data quality score drift over time with historical baselines and alerting.
Soda Cloud integrates with modern notification systems such as Slack, email, and incident management platforms. When issues are detected, automated alerts are created with contextual information including data lineage and estimated business impact. Metrics Observability is an advanced module within Soda Cloud that focuses on the automated detection of anomalies by analyzing key data quality metrics. It also enables users to deploy and manage data contracts directly through the Soda platform, with contracts fully editable within the UI.
Soda currently supports data content observability, data pipeline observability, and data lineage.
Deployment options: Public cloud/multicloud, SaaS, hybrid, VPC/private cloud, containers-based
Integration examples: Airflow; Alation; Atlan; dbt; Jira; Microsoft Teams; Okta; ServiceNow; Slack; Spark
Pricing and license models: Tiered pricing (based on product features, data assets monitored), trial version, open-source version
Telmai
Telmai is headquartered in California, U.S. Its data observability tool is Telmai. Telmai supports common cloud platforms, including Snowflake, Databricks, BigQuery, and Redshift, as well as open-table formats such as Apache Iceberg and Delta Lake. It also connects to object-storage-based environments across AWS, Google Cloud, and Microsoft Azure. Telmai uses a zero-copy, in-place monitoring model to evaluate data quality and data health at the source without replicating or moving data. This zero-copy principle delivers lower cost, higher security, and real-time visibility.
Telmai continuously validates data in real time across entire pipelines. It replaces manual, rule-based data quality testing with ML-driven anomaly detection that adapts to evolving data patterns. Telmai monitors data pipeline components, status, and performance by observing data as it moves through ingestion, transformation, and downstream analytical stages. It tracks indicators such as data arrival, freshness, volume changes, processing delays, partial loads, and schema or distribution shifts, rather than relying solely on job execution status.
Telmai is investing in agentic AI, where autonomous agents are capable of proactively analyzing, optimizing, and remediating data quality issues with minimal human oversight. These agents leverage the model context protocol (MCP) to communicate across systems and validate structured, semistructured, and unstructured data, enhancing overall operational efficiency.
Telmai currently supports data content observability, data pipeline observability, and data lineage.
Deployment options: On-premises, SaaS, hybrid, VPC/private cloud, containers-based
Integration examples: Alation; Atlan; Azure Active Directory; Microsoft Fabric; Power BI; ServiceNow; Slack; Starburst
Pricing and license models: Tiered pricing (based on product features, data environments to be connected or connectors to be used, volume of processed data), trial version
Unravel Data
Unravel Data is headquartered in California, U.S. Its data observability tool is the Unravel Data Observability and FinOps Platform. Unravel’s platform was primarily dedicated to FinOps and cost governance functionalities. Recently, the vendor expanded its features to include other types of observabilities for unified experience across various demands.
At the heart of Unravel’s platform is a telemetry engine that continuously collects, stores, and analyzes vast amounts of operational metadata. This includes performance metrics, logs, and cost-related data. The AI algorithms then process this raw data to provide predictive analytics, forecasting possible issues before they become critical. For example, by predicting spikes in resource usage, the system can recommend rightsizing recommendations that prevent budget overruns and ensure cost-efficient operations.
Unravel’s AutoApply Intelligence enables continuous, self-healing optimization that automatically applies validated recommendations without manual intervention. This autonomous automation capability enables organizations to shift from reactive troubleshooting to proactive prevention, automatically addressing infrastructure sizing, configuration, and resource allocation issues before they impact business operations. The platform includes automated value reconciliation using change-point detection to validate savings in real-time, providing auditable proof of optimization impact for every automated change.
Unravel Data currently supports all five observation categories.
Deployment options: Public cloud/multicloud, on-premises, SaaS, hybrid, VPC/private cloud, containers-based
Integration examples: Alation; Atlan; BigQuery; Email; Jira; Microsoft Purview; Power BI; ServiceNow; Slack; Tableau
Pricing and license models: Flat-rate pricing, trial version
Validio
Validio is headquartered in Stockholm, Sweden. Its data observability product is one of the components in its agentic data management platform. Validio offers native connectivity to a wide range of data sources across cloud-based or on-premises environments. Its compatibility with popular data warehouses, databases, streaming tools, transformation tools, and business intelligence platforms helps fast deployment without extensive reengineering of existing pipelines.
Validio provides 80+ out-of-the box monitors, in addition to custom SQL, to monitor pipeline health, including data volume, freshness, and schema changes to ensure data is available and meets operational SLAs. It tracks real-time system metrics and validates transformations within the data lakes and warehouses to alert on pipeline failures. Validio also integrates with orchestration and ETL tools to monitor the pipeline status and performance.
Validio users can implement resource monitoring by configuring custom SQL validators to track metrics such as Snowflake credit usage or BigQuery slot consumption, enabling visibility into cost distribution and resource allocation. Users can also implement cost monitoring to query underlying system tables to track credit consumption, slot usage, and storage costs per table or query. Validio applies AI-powered thresholds to any monitored metric, including cost data. This allows the automatic detection of spending anomalies (e.g., a sudden spike in compute) and the forecasting of future trends based on historical usage patterns.
Validio currently supports all five observation categories.
Deployment options: Public cloud/multicloud, on-premises, SaaS, hybrid, VPC/private cloud, containers-based
Integration examples: Airflow; Alation; Collibra; dbt; Looker; Okta; PagerDuty; ServiceNow; Slack; Tableau
Pricing and license models: Tiered pricing (based on number of users with access, data assets/tables to be monitored, resource consumption (for streaming data only), trial version (during the POC)
Market Recommendations
Gartner recommends D&A leaders take these actions to consider both technical and nontechnical aspects when navigating through data observability:
- Identify the gaps. There’s no need to tear down what you already have. Assess the gap between your current monitoring capabilities (via traditional data quality or DataOps tooling) and desired capabilities regarding critical data elements. These gaps are ideal use cases for piloting data observability tool implementations.
- Evaluate vendors with both technology and business in mind. Engage both business and technical personas early in the vendor evaluation process since they may have different requirements and expectations. Evaluate data observability tool offerings based on the priority of business requirements, primary users, and how the tools fit in the overall enterprise ecosystems.
- Evaluate the stock of connectors supported by vendors. Given the increasingly complex ecosystems and the amount of similar (and in some cases overlapping) capabilities, ensuring that this technology integrates and connects to your current ecosystem is critical. Be prepared to make trade-offs in highly diverse environments where no vendor may provide support for everything you need.
- Pilot first, optimize later. If available, implement a data observability tool in a cloud environment first because it is faster and easier to demonstrate value. Prioritize assessing the business value and return of the data observability tool rather than ensuring its technology optimization throughout the data ecosystem.
- As many vendors promise AI-enabled capabilities in the tools, D&A leaders should validate these AI features during the piloting phase to ensure the delivery of their promises.
- A clear understanding of pricing dynamics from vendors is essential as organizations weigh the benefits of integrated, AI-powered platforms against the risk of escalating operational costs, particularly as data volumes continue to rise.
- Consider both capabilities and requirements. When evaluating a data observability tool, consider adaptation or adjustment in processes, responsibilities, and skill sets necessary for securing the business values from data observability practices.
- Show tangible business benefits. Partner with business stakeholders to evaluate and demonstrate the business value of data observation practices. Include both business and technical users in the notification strategy, if necessary. Track the improvement of data quality within data pipelines, as well as their impact in business outcomes such as time saving or risk mitigation.
12025 Gartner State of AI-Ready Data Survey. This study was conducted to understand how data management organizations evolve for AI and to glean insight into how organizations are developing capabilities, skills, techniques, tools, and technologies to support AI-ready data. The research was conducted online from June through August 2025 among 250 respondents from North America (n = 100), EMEA (n = 70), Asia/Pacific (n = 50), and LATAM (n = 30). Quotas were established for company sizes and for industries to ensure a good representation across the sample. Respondents were screened for involvement and knowledge of data and analytics, data science, and AI strategy and initiative. Disclaimer: The results of this study do not represent global findings or the market as a whole, but reflect the sentiment of the respondents and companies surveyed.