Magic Quadrant for Developer Productivity Insight Platforms
5 May 2026 - ID G00835762 - 48 min read
By Frank O'Connor, Peter Hyde, and 2 more
To maximize AI-accelerated development, software engineering leaders should use developer productivity insight platforms. This research guides the selection of vendors that offer the required transparency and insights to measure AI ROI, enhance the developer experience and maximize value creation.
Strategic Planning Assumptions
- By 2028, 90% of developer productivity insight platforms will support workflow automation and contextual guidance, driving a shift from manager-focused dashboards to developer-focused enablement.
- By 2028, 60% of developer productivity platforms will act as foundational context engines, equipping agentic workflows with real-time environmental awareness, state management, robust knowledge retrieval, policy guardrails, and strict goal alignment.
Market Definition/Description
Gartner defines developer productivity insight platforms as solutions that provide software engineering leaders with both quantitative and quantitative visibility into the engineering team’s use of time and resources, operational effectiveness, and progress on value delivery. This enables software engineering leaders and their teams to find and remove productivity blockers, making teams more effective and efficient. Developer productivity insight platforms ingest and analyze large volumes of data generated by common engineering tools and systems. They provide rich, tailored and role-specific user experiences to help leaders more easily identify constraints, spot important trends and gain contextual insights.
Developer productivity insight platforms are used by software engineering leaders and their teams to gain a deeper understanding of how software solutions are being built and delivered. Teams can more easily see where they are spending their time and how they are approaching code quality, and gain a better understanding of the flow of value through key metrics like deployment frequency and cycle time. These platforms serve as a “single source of truth” for engineering process data, and provide a unified, comprehensive and transparent view of the engineering processes. Key engineering metrics categories for delivering digital products include throughput and predictability, quality and security, organizational effectiveness, and business value.
Software engineering leaders are coming under increasing pressure from C-suite leaders to provide more evidence-based measures of value delivery. This is a challenge, as the data that describes the engineering process is distributed across a large number of engineering systems, such as version control, work tracking and test management, as well as communication tools like email and instant messaging applications. Developer productivity insight platforms address this problem by providing off-the-shelf integrations to the most commonly used systems to make it easier to build a complete picture of software engineering health using both quantitative (e.g., cycle time) and qualitative data (e.g., DevEx survey data). Once the data has been collected and organized, these platforms generate engineering insights, which help software engineering leaders and their teams to tell the story of software delivery using data.
Organizations can utilize developer productivity insight platforms to gain a deeper understanding of their software development life cycles and gain valuable insights into how their teams build software. These organizations can utilize these insights to continually adjust, experiment with and refine their processes and practices, resulting in enhanced business alignment, higher-quality software, and happier, more productive teams.
Mandatory Features
- Ingest and correlate data from leading software engineering tools across the software development life cycle (planning, coding, testing, deployment).
- Collect qualitative data collection, such as DevEx surveys.
- Enable self-service onboarding without requiring professional services. Provide dependable customer support and enable fast, frictionless self-service onboarding for users.
- Generate and visualize key engineering metrics across a minimum of four categories: throughput and predictability, quality and security, organizational effectiveness, and business value.
- Support at least one recognized engineering metrics framework (e.g., DORA, SPACE, DX).
- Support role-based access and role-tailored dashboards/reporting (e.g., team view vs. management view).
- Provide capabilities to monitor trends, benchmark against industry averages and set targets or guardrails for key metrics, including internal and external team comparisons.
- Deliver actionable insights, recommendations and workflow automation (e.g., PR nudges, review routing).
- Provide secure, compliant and scalable data management with configurable privacy, residency and service controls; ensure adherence to recognized standards while supporting multitenant operations.
- Include predictive forecasting for delivery timelines and capacity planning.
- Expose APIs and export options for integration with business intelligence (BI) tools and custom reporting.
Optional Features
- Insights to measure the adoption, cost and impact of generative AI (GenAI) tools on team productivity and software.
- AI-driven scenario planning: Simulate delivery outcomes under different staffing, scope or priority changes.
- Integration with large language model (LLM)-based assistants: Enable natural language queries like “Show me teams at risk of missing Q4 goals.”
- Automated risk detection: Predict delivery risks (e.g., bottlenecks, burnout signals) using historical and real-time data.
- Intelligent resource optimization: Recommend optimal team composition or skill allocation for upcoming projects.
- Cross-tool semantic analysis: Use natural language processing (NLP) to detect emerging themes in tickets, commits and comments (e.g., rising tech debt).
- Continuous compliance monitoring: Flag deviations from coding standards, security policies or regulatory requirements.
- Gamified improvement programs: Offer team-level challenges and recognition tied to metric improvements.
- Sustainability metrics: Track the energy consumption or carbon footprint of build/test pipelines for environmental, social and governance (ESG) reporting purposes.
- AI-powered retrospectives: Autogenerate insights and discussion points for sprint reviews based on data trends.
- Support GitOps and policy‑as‑code workflows (e.g., validating repo/branch protection, PR review policies, CI quality gates) and surface violations with remediation guidance.
- Provide an open, well-documented API/SDK and webhook framework to build custom integrations and automations.
- Offer insights and analysis that link work to business initiatives and objectives and key results.
Magic Quadrant
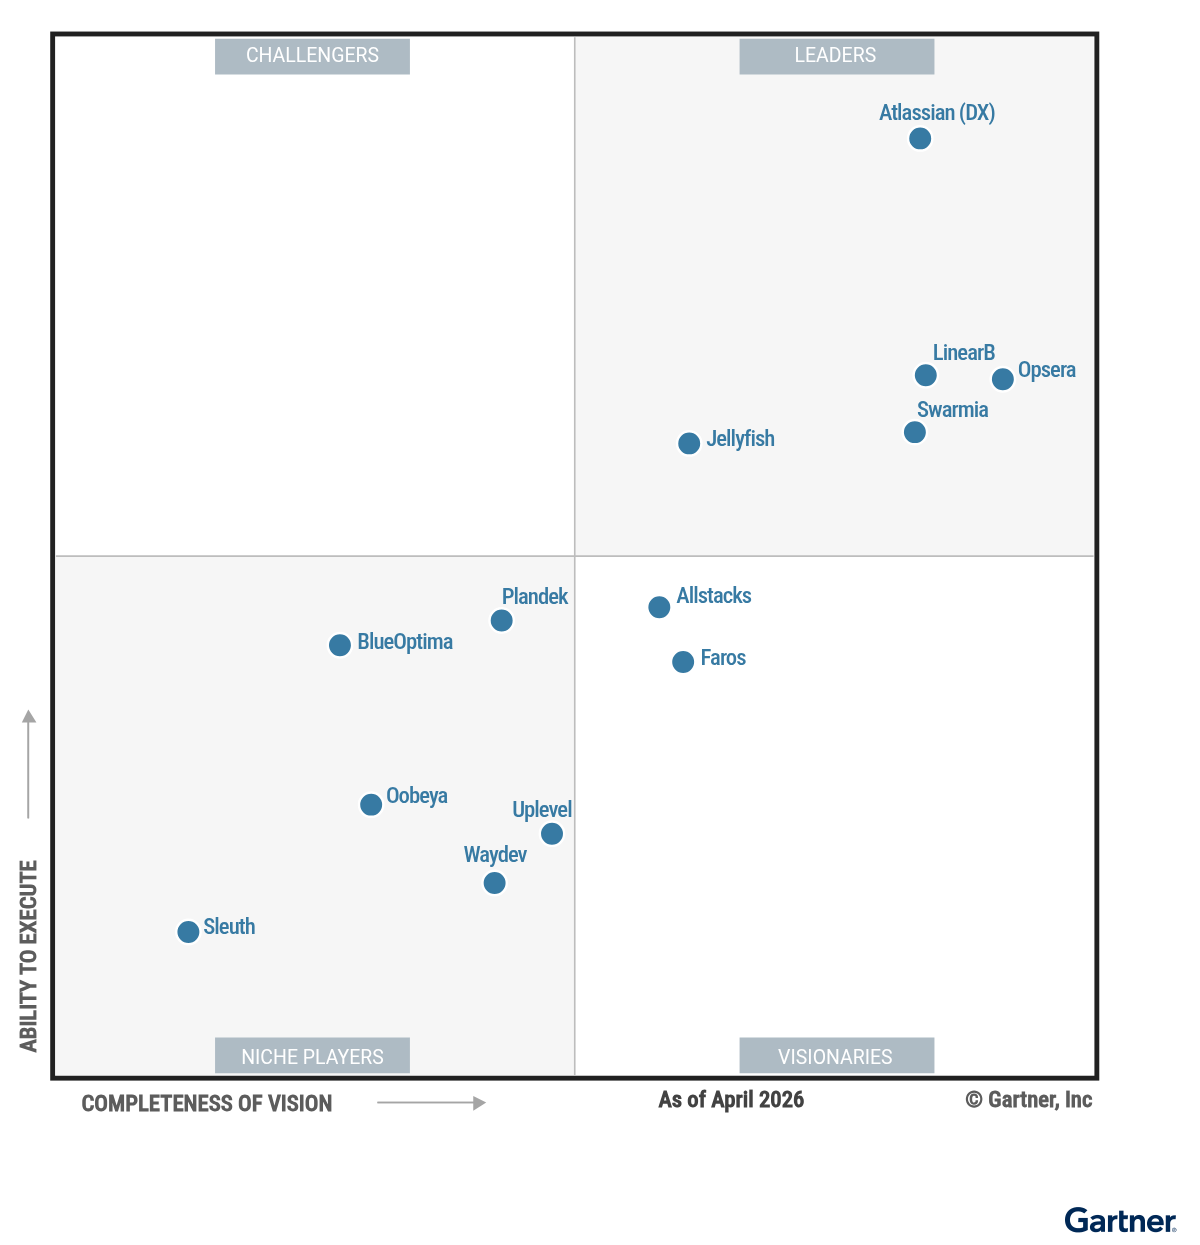
Vendor Strengths and Cautions
Allstacks
Allstacks is a Visionary in this Magic Quadrant. Its platform includes AI tool usage and impact metrics, quantitative and qualitative data collection, and delivery-tracking dashboards. Allstacks deploys via public or private cloud.
Allstacks customers are mainly in North America and EMEA, and its clients tend to be medium to large enterprises across various sectors, including financial services, healthcare, energy, and retail. In 2025, Allstacks delivered the Deep Agent Suite of specialized AI agents to perform developer productivity analysis, built on a proprietary context graph from the software development life cycle (SDLC) data as the foundation for agentic services.
- Market understanding: Allstacks has shifted focus to support its customers’ agentic operations, building a technical foundation of context graph based on ingested SDLC data. This allows Allstacks to deploy purpose-built agents to cover use cases such as identification of risks and workflow bottlenecks, with direct remediation actions.
- Customer experience: Allstacks uses detailed Net Promoter Score (NPS) and customer satisfaction (CSAT) surveys, as well as direct client engagement through quarterly reviews, to inform subsequent product decisions. This has resulted in high customer retention rates.
- Market responsiveness/record: Allstacks has responded to the demand for AI adoption and impact analysis measurements by introducing native integrations with popular AI tools, such as GitHub Copilot, Cursor, and Amazon Q, as well as an AI impact scorecard. The company has also invested in agents that deliver analysis for delivery risk and requirements readiness, in addition to investment allocation analytics.
- Geographic strategy: Allstacks is primarily focused on the U.S. and EMEA geographies, which are dominated by larger players. Organizations outside of these geographies should verify local support capabilities before committing to the platform.
- Sales execution/pricing: Calculation of the total cost of ownership can be challenging due to modular packaging and consumption-based pricing. Customers should invest additional time during procurement to model multimodule usage and longer-term cost trajectories.
- Overall viability: While Allstacks is investing in product development and market expansion, customers seeking to make long-term strategic commitments should be wary of potential delivery, roadmap, and support scalability risks.
Atlassian (DX)
Atlassian (DX) is a Leader in this Magic Quadrant. It offers DX, which includes quantitative and qualitative data collection, AI impact measurement, and role-based dashboards. DX deploys via public or private cloud, or on-premises.
Atlassian completed its $1 billion acquisition of DX in November 2025 and added the product to its Software Collection. For clarity, the vendor is listed as Atlassian (DX) in this research.
Atlassian DX customers are mainly in North America and EMEA, and its clients tend to be large enterprises across all sectors. During 2025, Atlassian (DX) added the DX AI Measurement Framework to provide clients with a research-based framework assessing AI utilization, impact and cost.
- Geographic strategy: With a physical presence across EMEA, North America and Asia/Pacific, Atlassian (DX) effectively supports distributed global enterprises. Atlassian is integrating DX, post acquisition, into its global sales and marketing strategy with dedicated sales, data residency, and localized product and language support.
- Market responsiveness/record: In 2025, Atlassian (DX) released the DX AI Measurement Framework to help engineering leaders track AI utilization, measure its impact and evaluate its cost. This framework enables organizations to move beyond industry hype and quantify the actual impact of AI on their teams.
- Offering (product) strategy: The comprehensive DX Core 4 Framework measures development speed, effectiveness, quality and impact. Effectiveness measures include the qualitative survey-based Developer Experience Index (DXI) which is a composite score derived from 14 standardized Likert-scale survey items.
- Vertical/industry strategy: Atlassian’s recent acquisition of DX creates a risk of vendor lock-in for DX customers and a potential disincentive to prioritize integrations with competing DevOps tools.
- Innovation: The DX platform lacks strong automation and active intervention capabilities. Other platforms offer extended automation, including reviewer assignment, AI code reviews, work prioritization, delivery risk agents and requirement-readiness agents.
- Operations: Atlassian DX has gaps in compliance certifications, such as SOC 1, and security standards, such as BSI C5, which could limit its appeal to enterprise customers with stringent operational requirements.
BlueOptima
BlueOptima is a Niche Player in this Magic Quadrant. Its platform includes developer performance analytics, vulnerability scanning and talent management functions. BlueOptima deploys via public or private cloud, or on-premises.
BlueOptima customers are mainly in North America and EMEA, and its clients tend to come from the banking and insurance sectors. In 2025, BlueOptima launched its AI Trust Layer to measure the impact of AI-generated code and released a near real-time secrets detection plugin for GitHub.
In October 2025, BlueOptima acquired Cirata’s DevOps solutions business to strengthen its global engineering performance capabilities.
BlueOptima declined requests for supplemental information. Gartner’s analysis is therefore based on other credible sources.
- Market responsiveness/record: BlueOptima has demonstrated market responsiveness by using its Global Benchmark of over 10 billion developer commits to detect development trends at scale, adjusting its roadmap, such as launching AI Trust and Code Author Detection, to address emerging productivity limits and code quality risks.
- Marketing strategy: BlueOptima’s marketing strategy reflects a disciplined focus on Fortune 500 needs, with notable traction in financial services and insurance, where objective, standardized productivity metrics support blended internal and third-party teams.
- Geographic strategy: BlueOptima supports global enterprises through its physical presence across North America, EMEA, and Asia/Pacific. Furthermore, its 2025 acquisition of Cirata’s DevOps business adds Active MultiSite technology, enabling geographically dispersed engineering teams to collaborate at local network speeds.
- Innovation: BlueOptima does not natively support established industry frameworks such as DORA or SPACE, instead centering its approach on its proprietary Billable Coding Effort (BCE) metric.
- Vertical/industry strategy: BlueOptima’s concentration in financial services and insurance drives reliance on sectors characterized by legacy systems and large outsourced workforces, constraining diversification and slowing adoption in adjacent verticals.
- Market understanding: BlueOptima’s rejection of subjective survey data signals a weak understanding of the modern developer productivity insight platform (DPIP) market. By ignoring qualitative metrics such as team satisfaction, the platform misses the industry shift toward holistically capturing productivity drivers. Organizations interested in using developer sentiment as an input to their productivity analysis will need a separate tool to fill this gap.
Faros
Faros is a Visionary in this Magic Quadrant. Its platform includes productivity assessments and ROI comparisons for AI tools, automated workflow and AI coding agent orchestration capabilities, and causal analysis of AI impact on productivity metrics. Faros deploys via public or private cloud, on-premises, or public cloud with a local data collector.
Faros’ customers are mainly in North America and EMEA, and its clients tend to be large enterprises with 1,000+ engineers, primarily from the technology and telecommunications sector. In 2025, Faros introduced agentic control and context engineering capabilities, which feed organizational context into agents to enable the delivery of context-aware, ready-to-merge pull requests (PRs). It also introduced the Generative AI Impact Net Score (GAINS) framework to benchmark organizations’ AI maturity and readiness.
- Market responsiveness/record: Faros’ go-to-market approach was shaped by the launch of its comprehensive AI impact measurement solution, which consolidates usage, cost, and model data across coding assistants, allowing customers to compare the relative impact of different AI tools. This enabled Faros to conduct longitudinal studies and publish its AI Productivity Paradox research, revealing that while individual developer output increases, organizational metrics remain flat. Based on this research, Faros developed the GAINS framework to help organizations assess AI maturity and identify the highest-value interventions to unblock AI gains.
- Offering (product) strategy: Faros offers 20+ prebuilt automation workflows and context engineering capabilities, equipping AI coding agents with organizational knowledge from past PRs and tickets to enable context-aware, standards-compliant workflows and enforce quality guardrails on brownfield codebases. Faros also combines self-service capabilities with expert guidance, using a high-touch approach that involves forward-deployed engineers and product managers who tailor insights and analytics to each client’s operating model and priorities.
- Sales strategy: Faros’ sales strategy targets large enterprise deals, leveraging strategic partnerships with hyperscalers, IT service providers, and AI tool vendors for co-selling opportunities. Faros has also introduced an outcome-based delivery model for its agentic coding services. This model charges customers based on the achievement of measurable improvements in engineering outcomes rather than a flat subscription or usage fee, reducing customer risk and positioning Faros as a results-driven partner.
- Geographic strategy: Faros has limited geographical diversification, with its client base concentrated in North America and Europe. Organizations outside of these geographies should verify local support capabilities and Faros’ regional partner networks before committing to the platform.
- Sales execution/pricing: Faros’ large deal sizes result in long sales cycles that may hinder long-term growth. It presently offers limited commercial packaging flexibility, specifically lacking enterprise unlimited licensing options.
- Vertical/industry strategy: A significant portion of Faros’ present customer base is from the technology sector, which may limit its appeal among customers across other sectors and increase its vulnerability to potential sector downturns.
Jellyfish
Jellyfish is a Leader in this Magic Quadrant. Its platform includes key features such as AI Impact measurement, business alignment, operational effectiveness, and DevFinOps. Jellyfish deploys via public or private cloud.
Jellyfish customers are mainly in North America and EMEA, and its clients tend to range from small startups to large enterprise corporations across various sectors, including technology and business services.
In July 2025, the Jellyfish AI Impact Framework demonstrated thought leadership by going beyond metrics to recommend operational improvements. The functionality transforms raw data into a strategic roadmap, helping software engineering leaders manage the hybrid human-AI transition by focusing on adoption maturity, productivity gains, and long-term business ROI.
- Marketing strategy: Jellyfish demonstrates strong go-to-market discipline, with execution tailored to software engineering leaders and platform decision makers. Jellyfish has adapted quickly to shifting customer demand, refining its messaging toward AI impact metrics and platform engineering visibility.
- Market understanding: Demonstrating a clear understanding of software engineering leadership priorities, Jellyfish connects engineering investment to business impact. Its customer-validated work allocation model translates metrics into measurable value, providing visibility into capacity, alignment with strategic goals, and early identification of delivery risks as organizations scale.
- Offering (product) strategy: Jellyfish demonstrates a forward-looking product vision with robust, dedicated capabilities that track the adoption and tangible productivity impact of generative AI (GenAI) coding tools. This strategy is actualized through its dedicated AI Impact module, which allows users to directly measure the adoption and productivity impact of GenAI investments.
- Product or service: Jellyfish’s primary focus on engineering leadership makes securing full developer buy-in challenging, as developers may view the platform as a management tool rather than a solution for themselves.
- Vertical/industry strategy: Jellyfish has limited industry or sectoral strategy, which may present adoption hurdles for organizations in highly differentiated sectors; for example, finance or insurance, where vertical-specific messaging and specialized sales teams are required.
- Sales execution/pricing: Jellyfish currently offers limited commercial packaging flexibility, specifically lacking pay-as-you-go or enterprise unlimited licensing options. This traditional per-seat model is becoming less relevant because it does not align with how AI is changing the nature of engineering work.
LinearB
LinearB is a Leader in this Magic Quadrant. Its platform includes AI productivity insights to measure the impact of AI coding tools, extensive workflow automation capabilities to streamline the software development life cycle, and investment profiling to align technical work with business goals. LinearB deploys via public cloud, on-premises, or public cloud with a local data collector.
LinearB customers are mainly in North America and EMEA, and its clients tend to be mid-market and large enterprises across all sectors. During 2025, a code review agent was released to run within Git workflows to analyze pull requests prior to merge and provide developers with specific, actionable findings.
- Market responsiveness/record: LinearB responded to clients’ need to measure the introduction of AI by providing a unified view across AI coding tools for AI adoption tracking, productivity measurement and delivery forecasting. AI-powered recommendations, supported by metric benchmarks, enable targeted automation and workflow acceleration.
- Marketing strategy: LinearB targets software engineering leadership roles with automated executive reporting on cost capitalization, resource allocation and project costs to enhance investment strategies and improve decision making.
- Market understanding: LinearB performs demand sensing through market research, conversation analysis and product intelligence to identify signals used to shape its product roadmap. This proactive approach allows the organization to understand market changes and to respond with successful features, such as the unified view for AI adoption.
- Customer experience: The learning curve for LinearB users can be steep given the quantity of metrics, integration complexity, challenging administration interface, and difficulty when aggregating multiple data sources and customizing for advanced use cases.
- Product or service: The qualitative developer experience surveys offered by LinearB lack the depth and post-survey natural language processing (NLP) seen in some competitors. This reflects the secondary importance LinearB gives to qualitative data.
- Vertical/industry strategy: LinearB lacks a differentiated market domain strategy, which may limit its appeal among companies that have industry- or sector-specific challenges to address.
Oobeya
Oobeya is a Niche Player in this Magic Quadrant. Its platform includes AI tool usage and impact evaluation capabilities, proactive issue detection and alerts, and role-based dashboards for productivity insights. Oobeya deploys via public or private cloud, or on-premises.
Oobeya customers are mainly in EMEA and South/Latin America, and its clients tend to be midsize to large enterprises with complex, distributed engineering environments, typically in regulated sectors. In 2025, Oobeya launched its AI impact measurement capability to help organizations correlate AI usage with delivery outcomes. Oobeya also invested in expanding its international presence to accelerate growth and diversify revenue distribution across regions.
- Sales strategy: To support its sales strategy of targeting organizations with regulated, complex engineering environments, Oobeya promotes its capabilities for identifying AI-related risks and governance gaps. The company also offers a broad range of flexible licensing and pricing options — such as subscription-based, usage-based, pay-as-you-go, and unlimited enterprise licenses, as well as tiered pricing models — to meet diverse customer needs and budgets.
- Market understanding: Oobeya recognized the growing demands for governance, quality control, and visibility in AI-native development, and addressed it via its Symptoms module and SDLC metric-monitoring framework. These capabilities help clients proactively identify delivery bottlenecks, workload imbalance, and delivery risks. In addition, Oobeya’s robust, configurable data ingestion capabilities and quick “time to first insight” (averaging 10-20 minutes) enable fast, in-depth historical analysis for clients.
- Marketing strategy: Oobeya’s marketing strategy centers on its partner-driven approach, leveraging a growing network of regional and global partners. By highlighting its ability to deliver localized expertise and seamless integration with trusted ecosystem partners, Oobeya appeals to enterprises seeking reliable, scalable solutions, especially those in regulated environments.
- Operations: Oobeya has gaps in critical compliance certifications, such as SOC 1 and SOC 2, which could limit its appeal to enterprise customers with stringent compliance requirements. In addition, Oobeya’s small deal sizes and short-term contracts, many less than a year, may constrain revenue growth and hinder long-term scalability.
- Customer experience: Oobeya does not tie account manager or account executive compensation to customer experience scores, lacks a customer advisory board, and offers limited prebuilt integrations for AI tools. These gaps impact customer experience, slow responsiveness to client needs, and limit the platform’s value for organizations seeking comprehensive AI tool integration.
- Offering (product) strategy: Oobeya has been slower than competitors to incorporate capabilities that are rapidly becoming industry standards. It lacks strong automation and active intervention capabilities, while its qualitative developer surveys offer limited configuration and format options and lack post-survey NLP capabilities. Oobeya also does not offer an AI assistant for intelligent insights, which can slow data interpretation and decision making.
Opsera
Opsera is a Leader in this Magic Quadrant. It offers Opsera Unified Insights, which includes GenAI impact measurement, DORA and SPACE framework metrics, qualitative engineering data collection, and the Hummingbird AI reasoning engine. Opsera deploys via public or private cloud, or on-premises.
Opsera customers are mainly in North America and EMEA, and its clients tend to be midsize to large enterprises across the technology and banking, financial services and insurance (BFSI) sectors.
In 2025, Opsera raised $20 million in Series B funding and delivered several new product innovations, including advanced reasoning AI and autonomous remediation agents for Agentic DevOps. During this same period, Opsera also introduced targeted account-based marketing (ABM) strategies focused on the highly regulated healthcare vertical.
- Innovation: Opsera demonstrates strong innovation by closing the gap between developer productivity data and execution. Instead of focusing on collecting and reporting signals, the platform uses developer insights to offer autonomous, policy-governed actions that can remove SDLC bottlenecks and drive improvement at scale.
- Marketing strategy: Opsera pairs top-down enterprise selling with bottom-up developer adoption. It targets regulated verticals through ABM while using AI-driven automation inside the product to help developers streamline their workflows. This combination builds grassroots developer demand while reinforcing executive-level trust and relevance in security-conscious industries.
- Sales strategy: Opsera supports strategic ecosystem partnerships and co-selling arrangements alongside a “Factory Model” approach with system integrators, which enables rapid, structured enterprise deployments.
- Geographic strategy: Opsera’s customer base is predominantly concentrated in North America, with its investments in the Asia/Pacific and European regions still maturing. Organizations outside of North America should verify local support capabilities and evaluate the maturity of Opsera’s regional partner networks before committing to the platform.
- Operations: Opsera’s heavy use of advanced AI capabilities increases its external dependency risk. The platform’s deep integration with fast-evolving tools, such as GitHub Copilot and Windsurf, makes it more dependent on third-party APIs. Changes to these APIs or data access models could directly affect metric accuracy, platform stability, and overall data integrity.
- Customer experience: Opsera’s initial deployment and integration processes can be demanding and may present a steep learning curve for new teams. This onboarding friction is compounded by general gaps in the platform’s available support materials and documentation.
Plandek
Plandek is a Niche Player in this Magic Quadrant. Its platform includes AI tool usage and value metrics, quantitative and qualitative data collection, and metrics dashboards. Plandek deploys via public cloud, or public cloud with a local data collector.
Plandek customers are mainly in EMEA, and its clients tend to be technology and private equity owned enterprises across various sectors, including financial services, healthcare, energy, and retail. In 2025, Plandek delivered Dekka, a “virtual engineering assistant” for real-time insights and workflow notifications, and invested in an AI transition framework called RACER.
- Marketing strategy: Plandek articulates a differentiated narrative around AI-augmented engineering as a transformation, not a tooling upgrade. It provides technology, frameworks and consulting support, which helps customers frame productivity initiatives in terms that resonate with executive stakeholders, rather than limiting discussions to operational metrics.
- Sales strategy: Plandek’s sales approach supports complex, multistakeholder buying journeys in which productivity improvement is treated as a program of work. This benefits customers that require alignment across engineering, leadership, and governance teams, rather than an analytics tool deployment.
- Market understanding: Plandek demonstrates a mature understanding of near-term market drivers, including AI impact measurement, delivery risk and regulatory pressure. Customers evaluating Plandek are more likely to encounter messaging and product direction aligned with current executive concerns, rather than retrospective productivity reporting.
- Geographic strategy: Plandek’s geographic footprint is weighted toward EMEA, with more limited field presence and ecosystem depth in the U.S. and Asia/Pacific region. Customers with globally distributed engineering organizations may encounter uneven coverage, fewer local references and reduced partner support.
- Marketing execution: Plandek executes its marketing strategy narrowly, as it relies on targeted thought leadership, limited partner networks and private equity channels, rather than broad, scalable marketing programs. Customers may need heavier direct vendor engagement to validate value and build internal consensus, particularly outside private-equity-led initiatives.
- Innovation: Plandek is lagging behind some other vendors in areas such as breadth of prebuilt integrations and user-friendly survey analysis. As a result, potential customers may see less evidence of consistent execution in these features than in a newer area, such as AI impact analysis.
Sleuth
Sleuth is a Niche Player in this Magic Quadrant. Its platform includes issue progress tracking, workflow automation and a strong focus on DevOps Research and Assessment (DORA) metrics. Sleuth deploys via public cloud.
Sleuth customers are mainly in North America and EMEA, and its clients tend to be mid-market software-driven organizations across all sectors. In 2025, Sleuth introduced customizable templates for data-driven meetings, “pulse” surveys for qualitative data collection and a marketplace for SDLC automations.
Sleuth declined requests for supplemental information or to review the draft contents of this document. Gartner’s analysis is therefore based on other credible sources.
- Marketing strategy: Sleuth markets itself as moving beyond static metrics and becoming part of a team’s workflow. An example of this is Sleuth Reviews, which provides collaborative, document-based workflows for transforming raw data into consumable reports. By using customizable templates to overlay quantitative DORA metrics with qualitative context, teams can collectively refine insights and add narrative before publishing completed reports. Pre-made templates include team sprint reviews, monthly state of engineering, investment mix and DORA.
- Offering (product) strategy: Sleuth Pulse augments quantitative data with qualitative feedback by triggering lightweight, Slack-based check-ins that capture real-time developer sentiment. By comparing these survey responses against DORA metrics, software engineering leaders can assess whether performance changes are influenced by system issues or human factors.
- Operations: Sleuth follows industry best practices for security, compliance and privacy. The company encrypts data in transit and at rest, is SOC 2 Type 2 certified, and is GDPR compliant.
- Innovation: Sleuth’s strategy remains heavily anchored on the four core indicators of DORA metrics. As the market shifts toward flow engineering and complex business alignment metrics, Sleuth’s “DORA-centric” view may be too narrow for organizations seeking deep financial or resource allocation modeling.
- Product or service: Sleuth maintains a smaller library of native out-of-the-box integrations compared with its competitors. While its generic webhook API allows for flexible data ingestion, these nonnative integration paths require manual configuration and lack the deep, two-way synchronization that helps to expand capabilities beyond simple metric reporting.
- Offering (product) strategy: Sleuth operates exclusively as a cloud-based platform, which serves as a significant barrier for organizations in highly regulated and air-gapped sectors that mandate on-premises hosting. The lack of a self-hosted version limits its total addressable market in constrained environments.
Swarmia
Swarmia is a Leader in this Magic Quadrant. Its platform includes qualitative and quantitative engineering metrics, support for strategic decision making, and workflow automation and notifications. Swarmia deploys via public cloud, or public cloud with a local data collector.
Swarmia customers are mainly in North America and EMEA, and its clients tend to be high-growth tech startups and software-driven enterprises across all sectors. In 2025, Swarmia expanded its capabilities with a dedicated AI coding agents dashboard and a natural-language-powered report builder to automate software capitalization and investment balance tracking.
- Marketing strategy: Swarmia is marketed to engineering leadership as providing strategic decision making through reliable, consolidated data. A differentiating feature in this strategy is the Investment Balance Dashboard, which categorizes engineering work, including new features, defects, infrastructure and maintenance, to reveal hidden constraints and guide data-driven discussions on roadmap trade-offs and ROI.
- Market understanding: Swarmia demonstrates a keen understanding of current market trends by introducing a suite of features designed to evaluate the impact of AI and agentic capabilities. Furthermore, the company is positioning itself as an “engineering context engine” to accelerate and maximize AI effectiveness across development teams.
- Offering (product) strategy: A core part of Swarmia’s product strategy is driving process improvement through “working agreements.” These agreements act as active guardrails, allowing teams to set custom goals, such as merging pull requests within five days, and receiving automated nudges to meet these targets. Team digests create visibility into ongoing work and highlight completed work. Working agreements empower teams to adopt proven ways of working, enable automated reminders and track progress over time.
- Sales execution/pricing: Swarmia operates exclusively as a cloud-based platform, which serves as a significant barrier for organizations in highly regulated sectors that mandate on-premises solutions. While a local proxy agent is available for secure outbound connections, the cloud processing model remains a challenge for strictly air-gapped or regulated environments.
- Product or service: Swarmia does not currently feature native AI agents that perform engineering tasks, such as code review, issue triage or documentation updates. While it measures agentic impact, it lacks the active execution capabilities found in platforms moving toward autonomous workflow management.
- Customer experience: Beyond extensive integrations with human resources information systems (HRIS), Swarmia offers fewer native integrations for non-standard issue trackers and CI/CD tools than its competitors. This will hinder adoption in enterprises with fragmented toolchains.
Uplevel
Uplevel is a Niche Player in this Magic Quadrant. Its platform includes AI impact analysis, capacity planning, productivity improvement planning capabilities, and goal allocation analysis that aligns engineering work with strategic outcomes. Uplevel deploys via public or private cloud, or on-premises.
Uplevel customers are mainly in North America, Europe and Asia, and its clients tend to be enterprise and growth-stage engineering organizations with 500+ developers navigating AI-driven change. During 2025, Uplevel launched a capability to map engineering work to business goals using large language model (LLM-based) classification, enabling leaders to make informed trade-off and capacity allocation decisions, aligned with strategic initiatives.
- Innovation: Uplevel invests heavily in R&D to build differentiated features. One of its innovative features includes a business value assessment capability that maps engineering effort to strategic initiatives using LLMs that analyze pull requests, tickets, and other metadata. This helps leaders justify technology investments, demonstrate ROI, and make informed capacity allocation decisions.
- Marketing strategy: Uplevel differentiates itself by marketing its capabilities to drive productivity improvements and AI impact, rather than focusing only on measurement. The company’s messaging emphasizes its ability to help clients identify and address bottlenecks from AI-driven code generation, and develop actionable improvement plans. The platform’s capability to align team-generated productivity improvement ideas with key leadership priorities also enhances its appeal to both engineering teams and executives.
- Offering (product) strategy: A core element of Uplevel’s product strategy is enabling sustained productivity improvement and AI-driven transformation planning for clients. Uplevel’s WAVE framework assesses KPIs across ways of working, alignment, velocity, and environment efficiency, delivering a holistic view of engineering effectiveness and guiding targeted improvements. By focusing on supporting productivity improvements, Uplevel positions itself to secure long-term, multiyear contracts (three to five years) with clients that are tied to improvements, not just dashboards.
- Operations: Uplevel has gaps in certain compliance certifications, such as ISO 27001, and emerging region- and industry-specific standards, which could reduce its appeal to customers with strict operational or compliance requirements.
- Customer experience: Uplevel’s initial data ingestion processes can be time consuming, with an average “time to first insight” for a new team onboarding to the platform taking up to a month for large organizations. This may hinder user adoption and delay the realization of business value.
- Marketing execution: Uplevel’s marketing approaches lack regional differentiation and rely mainly on consulting firm partnerships, which can hinder market visibility and limit its appeal to potential customers.
Waydev
Waydev is a Niche Player in this Magic Quadrant. Its platform includes DORA and workflow metrics, AI adoption and impact analytics, and developer experience surveys. Waydev deploys via public or private cloud, or on-premises.
Waydev customers are mainly in North America and EMEA, and its clients tend to be midmarket to enterprise software-driven organizations. These include clients in regulated sectors such as financial services and healthcare, as well as enterprise SaaS vendors. In 2025, Waydev launched AI adoption and impact measurement dashboards. It also added stronger governance and attribution controls, and introduced executive dashboards that connect engineering telemetry to cost, risk and business outcomes.
- Market understanding: Waydev emphasizes AI impact, including executive ROI measurements, governance and business-outcome alignment, rather than developer activity metrics. Customers that need to justify AI spend and standardize engineering measurement are more likely to find the platform aligned with current decision criteria and emerging stakeholder demands.
- Marketing strategy: Waydev avoids surveillance-style positioning and instead markets around transparency, improvement, and outcome-based engineering intelligence. This approach lowers teams’ cultural resistance during the evaluation process, making the platform easier to position as an operational improvement tool, rather than a monitoring system.
- Operations: Waydev combines multiple deployment options with workflow alerts, governance features and support for complex, multitool environments. Potential customers in regulated or heterogeneous environments therefore gain greater flexibility in how they can deploy and govern the platform, lowering adoption friction.
- Customer experience: Waydev’s customer feedback collection, prioritization and service improvement are less systematic than those of other companies in this market, which have more clearly established customer experience practices.
- Marketing execution: Potential customers must do more of their own validation because Waydev offers fewer visible proof points, partner signals and market references than better-established competitors. This makes it harder to build internal consensus and justify Waydev as a strategic platform choice.
- Product or service: Natural language processing of qualitative feedback, automation and orchestration, agent attribution and reporting flexibility remain immature or incomplete. This leaves customers to do more interpretation and follow-through themselves, which weakens Waydev’s fit for organizations that want a more automated and adaptable platform for engineering improvement.
Inclusion and Exclusion Criteria
To qualify for inclusion in this Magic Quadrant, each vendor must meet the following criteria:
- The vendor must offer its primary developer productivity insight platform (DPIP) as a stand-alone or base configuration (lowest-edition tier) license that does not require the purchase of other independent product SKUs.
- The product must be enterprise-grade and aimed at enterprise-class projects through the platform, providing:
- High availability and disaster recovery
- Secure access to applications
- Technical support to customers
- Third-party application access to application logic and/or data, via APIs and/or event topics
- The product or service must meet all the mandatory features of the market definition.
- The vendor must have revenue of at least $6 million for DPIP licenses and subscriptions in the last year ending 31 December 2025, or 30% or more year-over-year growth in revenue for the previous year for DPIP licenses and subscriptions, excluding professional services or other related product offerings, in the last year ending 31 December 2025.
- The vendor must have at least 20 paying customer organizations (of at least 500 employees) for its DPIP offering, excluding other related product offerings, as of 31 December 2025.
- The vendor/product must be regularly identified by Gartner clients and prospects as a notable solution in the developer productivity insight platform market.
- The vendor must have direct customers (ie, not through resellers) within at least three of the following geographies:
- North America
- South America
- Europe
- Middle East and Africa
- Asia/Pacific
Reported revenue and or growth metrics must be attributed only to the DPIP SKU and may not include contributions from any other products or services.
Vendors are excluded for any one of the following reasons:
- They require a specific, licensed, third-party component or product that is not already included in their platform(s) — that is, branded, sold and supported directly by the vendor.
- They only sell their platform(s) with, and for the use of, their professional services and consultants.
- They require the purchase and/or installation of other unrelated products or platforms offered by the same vendor (e.g., a CRM application or content management system).
- They do not offer a commercially supported enterprise offering — that is, they only offer the platform(s) as open-source software.
Honorable Mentions
Port is an internal developer portal and agentic engineering platform. It aims to unify software catalogs, developer productivity insights, and automations. Its features are designed to provide developers with autonomy and established development paths, supported by insights into developer workflows. Port did not meet the full inclusion criteria for this market.
Harness Software Engineering Insights offers a data-driven view into the SDLC. Leveraging its Trellis Framework and AI-powered analytics, the platform integrates data from over 40 tools to track DORA metrics, developer velocity and business alignment. Harness helps engineering leadership balance quantitative output with engineering health to enhance the overall developer experience. Currently, Harness does not offer a stand-alone DPIP product option and therefore did not qualify for inclusion in this Magic Quadrant.
Code Climate is an engineering intelligence platform that supports enterprises transitioning to AI-native software development. It provides shared visibility for business and engineering stakeholders by tracking transformation progress from early adoption to long-term business impact. Code Climate did not meet the full inclusion criteria for this market.
Valven provides an AI-powered engineering intelligence and software delivery management platform that integrates with development pipelines to provide deep visibility into the SDLC. By automatically tracking delivery metrics, analyzing work patterns and using AI to forecast sprint outcomes, it empowers engineering leaders and product managers to eliminate bottlenecks, optimize resource allocation and continuously accelerate software delivery. Valven did not meet the full inclusion criteria for this market.
Evaluation Criteria
Ability to Execute
Product or Service
We specifically considered the critical capabilities of the software DPIP as demonstrated through responses to RFI, as well as supporting data from vendor briefings, product demos and internal research.
Overall Viability
We specifically looked for revenue, profit, customer growth and satisfaction; platform investments; employee and customer geographic distribution; and company size.
Sales Execution/Pricing
We specifically looked for new customer acquisition; average deal size for the 12 months ending 31 December 2025; licensing/pricing models and contract term lengths. We also looked for dedicated sales resources, average sales cycle for 2024 and 2025, and key sales partners. In addition, we referenced information from vendor briefings and internal research.
Market Responsiveness/Record
We specifically looked for the number of minor and major releases in the past 12 months and the provider’s analysis of market trends. We also examined methods used to detect and respond to market changes, as well as customer retention rates over the past three years, with additional context provided by vendor briefings and internal research.
Marketing Execution
We specifically looked at the success of recent campaigns, dedicated marketing resources and their allocation, and marketing budget as a percentage of annual revenue for 2024 and 2025. This was supplemented by vendor briefings and internal research.
Customer Experience
We specifically looked for how vendors measure customer experience (CX), the impact of CX scores on account manager compensation, how customers were represented at the vendor (e.g., the existence of a customer advisory board), and significant CX issues in the past 12 months. Supporting information was gathered from a new customer survey, vendor briefings and internal research.
Operations
We specifically looked for the number of FTEs overall and those dedicated to the product for 2024 and 2025, as well as operational, organizational or compliance certifications. This was supplemented by vendor briefings and internal research.
Ability to Execute Evaluation Criteria
| Evaluation Criteria | Weighting |
|---|---|
Product or Service | High |
Overall Viability | High |
Sales Execution/Pricing | Medium |
Market Responsiveness/Record | High |
Marketing Execution | Low |
Customer Experience | Medium |
Operations | Medium |
Gartner (May 2026)
Completeness of Vision
Market Understanding
We specifically looked for strategic investments, demand sensing capabilities, competitive analysis and understanding of market disruption. This included how the provider anticipates market evolution, differentiates from competitors and adapts offerings in response to market changes. Additional context was provided by vendor briefings and internal research.
Marketing Strategy
We specifically looked for updates to marketing strategy, platform messaging and persona targeting. This included go-to-market strategy, targeted buyer personas and recent impactful changes to marketing approach. Additional context was provided by vendor briefings and internal research.
Sales Strategy
We specifically looked for sales strategy updates, new client and current client growth, customer feedback regarding pricing and negotiations, and license and pricing models. This encompassed ideal customer profiles, planned changes to channel and sales strategy, pricing adjustments, effective sales strategies and planned licensing/pricing model changes. Additional context was provided by vendor briefings and internal research.
Offering (Product) Strategy
We specifically looked for product and platform roadmap, near-term product and platform priorities and incorporation of customer feedback. This included planned product features and enhancements, deployment models, primary user roles, automation capabilities, product strategy priorities and feedback incorporation. Additional context was provided by vendor briefings and internal research.
Vertical/Industry Strategy
We specifically looked for regulations addressed, vertical and industry customer success and areas of vertical or industry focus. This included adjustments to vertical/industry strategy and plans to address emerging industry-specific standards and regulations. Additional context was provided by vendor briefings and internal research.
Innovation
We specifically looked for patent activity recently delivered, planned innovation, and R&D investment and management. This included recently delivered innovative capabilities, future planned innovations, recent patents and R&D investment levels. Additional context was provided by vendor briefings and internal research.
Geographic Strategy
We specifically looked for region-specific regulation support, completed and planned updates to geographic support strategy, and alignment of strategy to growth. This included adjustments to geographic/regional focus, fastest-growing regions, plans to address emerging region-specific standards and regulations, and revenue distribution by region. Additional context was provided by vendor briefings and internal research.
Completeness of Vision Evaluation Criteria
| Evaluation Criteria | Weighting |
|---|---|
Market Understanding | High |
Marketing Strategy | Low |
Sales Strategy | Low |
Offering (Product) Strategy | High |
Business Model | NotRated |
Vertical/Industry Strategy | Low |
Innovation | High |
Geographic Strategy | Low |
Gartner (May 2026)
Quadrant Descriptions
Leaders
Leaders demonstrate strong execution across multiple functional use cases and deliver meaningful business outcomes through enterprise-grade DPIP capabilities. Leaders show consistent roadmap momentum, have a clear market vision, and have the operational maturity, CX and market presence to support cross-functional deployments at scale.
Challengers
Challengers have a more focused DPIP strategy and more comprehensive platform than Niche Players. They have the size and product capabilities to compete worldwide, but they might not be able to provide a compelling vision. Challengers execute well across multiple functional use cases and sizes of business.
However, there are no Challengers in this year’s Magic Quadrant, mainly due to strict inclusion criteria and the market’s early stage. Major players such as GitHub, GitLab, Harness and Port offer strong developer productivity capabilities, but are excluded because DPIP is not their primary business. In this emerging market, vendors often skip the Challenger stage, becoming Visionaries through rapid innovation or Niche Players by focusing on specialized solutions.
Visionaries
Visionaries deliver innovative and potentially market-changing solutions, but they struggle to meet the needs of all organizations due to geographic limitations, company size constraints and/or specific product limitations. Visionaries have strong potential to influence market direction, but are limited in terms of execution and/or track record.
Niche Players
Niche Players sometimes offer the best solutions for the needs of organizations of a particular size or industry, considering the price-to-value ratio of their solutions. However, they may lack specific functionality; focus support on fewer functions, industries or regions; or lack the investment required to scale their customer base.
Context
Software engineering leaders must effectively leverage DPIPs to maximize value from AI-accelerated development efforts. Use these solutions to gain the necessary transparency and insights to measure AI ROI and enhance the overall developer experience. The following key steps are recommended for leaders to successfully select, implement and integrate DPIP capabilities into their engineering strategy:
- Run real pilots: Evaluate DPIP vendors using quick pilots with production repositories and work-tracking data to validate insight quality, time to first value, and data hygiene assumptions before committing.
- Prepare the source data: Review current work-tracking discipline and workflow consistency to accelerate time to first insight and reduce misleading analytics during early adoption.
- Look for real insights: Favor vendors with contextual engineering capabilities that span the SDLC and deliver actionable outputs, such as bottleneck alerts or automated scripts, rather than static dashboards.
- Baseline AI productivity: Use DPIP platforms to baseline productivity before, during and after AI rollouts to justify ongoing investment.
- Elevate DevEx capabilities: Treat developer experience as a leading productivity indicator, not a soft metric, recognizing that strong DevEx enables the creativity required to deliver complex AI solutions (see Developer Experience Assessment.)
- Build shared ownership: Select DPIP platforms through cross-functional evaluation teams that include managers, developers and AI specialists, ensuring value at every level and avoiding “management-only” perceptions (see Community of Practice Essentials.)
- Rationalize platforms: Assess whether existing DevOps platforms (such as Harness or GitHub) can provide sufficient developer productivity insight, AI impact measurement and actionability before adding new DPIP vendors to limit sprawl.
- Regularly review: Embed regular DPIP insight reviews into delivery, architecture and investment forums so the platform drives continuous improvement, not passive reporting.
Market Overview
The developer productivity insight platform (DPIP) market is undergoing a rapid and material transformation, evolving from a niche category of engineering analytics into a strategic capability for modern enterprises. Gartner defines these platforms as solutions that provide software engineering leaders with data-driven insights into their teams’ use of time, resources, operational effectiveness and progress on deliverables.
By ingesting metadata from a fragmented ecosystem of version control, work tracking and communication tools, DPIP solutions create a unified single source of truth. This enables leaders to move beyond anecdotal evidence toward a quantitative narrative of value delivery, encompassing team flow, business alignment, software quality and organizational health.
Gartner estimates the DPIP market size at approximately $400 million with an average growth rate of over 40%, based on an assessment of global organizational spending on data-driven engineering analytics platforms.
A strong indicator of the market’s significance is Atlassian’s $1billion acquisition of DX, a developer productivity and engineering intelligence platform. While this acquisition does not directly define the market’s size, it demonstrates that large vendors view this space as both strategic and fast growing, supporting the plausibility of a market already in the hundreds of millions of dollars and scaling rapidly.
This Magic Quadrant represents the first formal evaluation of the DPIP market, replacing the previously published representative vendor Market Guide. Its introduction reflects the market’s progression toward critical maturity, increased vendor differentiation and growing executive-level relevance, particularly as organizations seek to govern large-scale investments in AI-enabled software delivery.
DPIP Current State and Future Outlook
The 2024-2025 period marked an inflection point for the DPIP market. During this time, buyer focus expanded beyond narrowly defined, objective productivity metrics. Instead, it moved toward a broader understanding of developer experience (DevEx) and its role in sustainable software delivery.
Since then, market momentum has shifted decisively toward understanding and governing the impact of AI across the software development life cycle (SDLC). The primary catalyst for the market’s recent acceleration is the widespread adoption of AI coding assistants, automated test generation, and agent-based workflows. Historically, DPIP adoption was hindered by the prevalence of internally built dashboards and a perception of high switching costs. However, the urgent need to measure ROI and risk, and to realize value from AI-driven development, has fundamentally altered buyer priorities.
Moving forward, organizations are increasingly deploying DPIP solutions as formal, structured mechanisms to evaluate AI effectiveness, compare outcomes across teams and guide long-term AI rollout strategies. This has elevated DPIP from a tactical reporting function to a foundational pillar of enterprise AI governance and engineering strategy, driving annual growth rates that significantly exceed historical averages.
Execution Challenges
Despite strong tailwinds, the market continues to face meaningful execution challenges. Poor data hygiene within work-tracking and development systems, characterized by incomplete workflows, inconsistent metadata and unstructured inputs, remains a pervasive issue. This inconsistency reinforces the “garbage in, garbage out” risk inherent in analytics-driven platforms. Additionally, many enterprises operate hybrid delivery environments where critical work is tracked in ERP, CRM or line-of-business systems, rather than in standard engineering tools. Integrating these systems often requires customized connectors that increase setup complexity and reduce analytical fidelity.
As a result, some buyers report extended implementation cycles and prolonged “time to first insight,” which can negatively affect perceived value and stall transformation initiatives.
Cultural resistance complicates adoption. As DPIPs ingest increasingly granular telemetry from development activities, Gartner clients tell us they are concerned that developers may perceive these platforms as tools for micromanagement rather than enablement. In response, leading vendors are repositioning their platforms to emphasize developer-centric value. The market is shifting away from manager-only dashboards toward team-level and individual insights designed to support self-improvement and flow optimization.
This shift is reflected in the growing inclusion of features targeted at product teams. Examples include workflow orchestration and guidance capabilities. There is also a deeper integration with developer communication tools. This includes embedding automated reminders or nudges within Google Chat, Microsoft Teams or Slack.
The delivery of prescriptive recommendations, such as reusable code patterns or templates, further supports this trend. These tools help developers resolve bottlenecks rather than merely surfacing them.
At the market structure level, the dedicated DPIP segment faces consolidation pressure from larger DevOps and internal developer portal (IDP) ecosystem providers. Vendors such as GitHub, Harness and Port have begun integrating productivity and insight capabilities directly into broader delivery platforms, offering a unified view of delivery, reliability and developer experience. This trend challenges the sustainability of pure-play DPIP vendors that lack adjacent platform leverage.
Concurrently, the rapid emergence of AI-native development tools introduces a risk of obsolescence through metric fragmentation. Many AI coding tools now provide embedded productivity indicators targeted at senior leadership. While these metrics are appealing, they are often narrow in scope and lack SDLC-wide context. This creates a growing “metric gap” between localized AI performance indicators and holistic engineering effectiveness. DPIP vendors must aggressively bridge this gap to remain the authoritative source of truth for enterprise engineering performance.
Market Direction: 12-24 Month Outlook
Looking forward, Gartner expects DPIP innovation to concentrate on the following areas:
- DevEx and organizational health as core metrics. Vendors will treat developer experience as a prerequisite for AI-enabled productivity. Sentiment analysis, pulse surveys and qualitative feedback loops will be integrated alongside flow and quality metrics to model software delivery as a sociotechnical system.
- Expanded workflow automation and IDP alignment. DPIPs will incorporate features traditionally associated with IDPs, including workflow automation, service onboarding insights and contextual guidance embedded directly within development environments.
- AI-informed prompt and workflow optimization. Insights derived from how software is built will be used to inform better context engineering, enabling organizations to systematically improve the effectiveness and consistency of AI-assisted development.
- Value-oriented AI measurement. Metrics will evolve beyond activity and output to quantify business value relative to AI operating costs, such as correlating delivered outcomes to token consumption, infrastructure usage and downstream business impact.
- Human and agentic workforce modeling. DPIPs will be used to understand how organizations evolve as they adopt hybrid workforces composed of human developers and autonomous or semiautonomous AI agents, requiring new models for capacity, governance and accountability.
- Pivot to context engines. As large language models become commodities, competitive advantage shifts to proprietary, curated business context. The focus is moving toward systemic AI, integrated data, memory and tool ecosystems that deliver more accurate and impactful outcomes. Extensive data integrations give DPIPs a distinct edge as they expand into this space.
2025 Gartner Impact of GenAI on Tech Providers Survey. The survey was designed to understand the impact of generative AI (GenAI) on revenue, profitability and sustained enterprise performance among technology and service providers. It also examined how GenAI is being integrated into products and services. The survey was conducted online in April and May 2025. It includes responses from 498 technology and service provider executives based in North America (n = 198), Western Europe (n = 161) and Asia/Pacific (n = 139). Respondents were required to be actively engaged in artificial intelligence as an emerging technology, with direct involvement in GenAI initiatives. Participants held roles across the C-suite, marketing and product marketing, product development and engineering, demand generation, industry or regional leadership, service delivery, line of business, and innovation functions. Quotas were applied across regions, company revenue, job functions and product offerings (software or SaaS and IT services) to ensure balanced representation. Of the respondents, 124 were from companies with annual revenue of between $5 million and $250 million, and 374 from companies with revenue above $250 million.
Disclaimer: The results of this survey do not represent global findings or the market as a whole, but reflect the sentiments of the respondents and companies surveyed.
Disclaimer: The results of this survey do not represent global findings or the market as a whole, but reflect the sentiments of the respondents and companies surveyed.
Ability to Execute
Product/Service: Core goods and services offered by the vendor for the defined market. This includes current product/service capabilities, quality, feature sets, skills and so on, whether offered natively or through OEM agreements/partnerships as defined in the market definition and detailed in the subcriteria.
Overall Viability: Viability includes an assessment of the overall organization's financial health, the financial and practical success of the business unit, and the likelihood that the individual business unit will continue investing in the product, will continue offering the product and will advance the state of the art within the organization's portfolio of products.
Sales Execution/Pricing: The vendor's capabilities in all presales activities and the structure that supports them. This includes deal management, pricing and negotiation, presales support, and the overall effectiveness of the sales channel.
Market Responsiveness/Record: Ability to respond, change direction, be flexible and achieve competitive success as opportunities develop, competitors act, customer needs evolve and market dynamics change. This criterion also considers the vendor's history of responsiveness.
Marketing Execution: The clarity, quality, creativity and efficacy of programs designed to deliver the organization's message to influence the market, promote the brand and business, increase awareness of the products, and establish a positive identification with the product/brand and organization in the minds of buyers. This "mind share" can be driven by a combination of publicity, promotional initiatives, thought leadership, word of mouth and sales activities.
Customer Experience: Relationships, products and services/programs that enable clients to be successful with the products evaluated. Specifically, this includes the ways customers receive technical support or account support. This can also include ancillary tools, customer support programs (and the quality thereof), availability of user groups, service-level agreements and so on.
Operations: The ability of the organization to meet its goals and commitments. Factors include the quality of the organizational structure, including skills, experiences, programs, systems and other vehicles that enable the organization to operate effectively and efficiently on an ongoing basis.
Completeness of Vision
Market Understanding: Ability of the vendor to understand buyers' wants and needs and to translate those into products and services. Vendors that show the highest degree of vision listen to and understand buyers' wants and needs, and can shape or enhance those with their added vision.
Marketing Strategy: A clear, differentiated set of messages consistently communicated throughout the organization and externalized through the website, advertising, customer programs and positioning statements.
Sales Strategy: The strategy for selling products that uses the appropriate network of direct and indirect sales, marketing, service, and communication affiliates that extend the scope and depth of market reach, skills, expertise, technologies, services and the customer base.
Offering (Product) Strategy: The vendor's approach to product development and delivery that emphasizes differentiation, functionality, methodology and feature sets as they map to current and future requirements.
Business Model: The soundness and logic of the vendor's underlying business proposition.
Vertical/Industry Strategy: The vendor's strategy to direct resources, skills and offerings to meet the specific needs of individual market segments, including vertical markets.
Innovation: Direct, related, complementary and synergistic layouts of resources, expertise or capital for investment, consolidation, defensive or pre-emptive purposes.
Geographic Strategy: The vendor's strategy to direct resources, skills and offerings to meet the specific needs of geographies outside the "home" or native geography, either directly or through partners, channels and subsidiaries as appropriate for that geography and market.