Critical Capabilities for Analytics and Business Intelligence Platforms
15 July 2026 - ID G00840720 - 53 min read
By Edgar Macari, Christopher Long, and 2 more
D&A leaders should consider adopting agentic analytics to move from passive reporting to autonomous, decision-driving systems that continuously sense, reason and act at enterprise speed and scale. This research will help guide their choice of vendor solutions in the analytics and business intelligence space.
Overview
Key Findings
- While traditional dashboards will continue to play an important role, agentic analytics capabilities empower teams across the organization to move toward a way of working where insights and actions are proactive and embedded within business processes.
- Inconsistent metrics and definitions remain a persistent challenge as analytics become embedded in workflows. This leads to confusion, misinformed decisions and a lack of trust in analytics across the organization.
- Human-driven analytics models are increasingly insufficient — in depth and timeliness — for organizations seeking proactive insights and actions. This limitation can prevent businesses from identifying opportunities or risks early, hindering their ability to make timely, data-driven decisions that drive competitive advantage.
Recommendations
- Prioritize solutions that offer robust agentic analytics capabilities (e.g., agentic insights and embedded analytics) alongside traditional dashboard functionality. This ensures that insights and recommended actions are integrated into business workflows, allowing teams to act swiftly and strategically rather than relying solely on retrospective analysis.
- Implement a governed interoperable semantic layer to standardize metrics and business definitions. This ensures consistent business logic across analytics assets and AI agents, building trust and supporting accurate decision making.
- Evaluate and adopt the agentic analytics capabilities offered in analytics and business intelligence (ABI) platforms capable of continuously monitoring data, detecting patterns and generating real-time, actionable insights without human intervention. This shift will allow organizations to extend analytical capacity, drive innovation and enhance operational agility.
Strategic Planning Assumptions
- By 2028, GenAI and RPA techniques will automate the migration of 40% of content between analytics platforms, reducing vendor lock-in and driving competitive pricing.
- By 2028, 60% of existing dashboards will be replaced by GenAI-powered narrative and visualization.
- By 2028, over 90% of vendors offering GenAI and agentic AI capabilities will lead with outcome and consumption-based pricing models.
What You Need to Know
This 2026 iteration of the Critical Capabilities for Analytics and Business Intelligence Platforms has added five new capabilities: agentic insights, analytics governance, conversational analytics, insight delivery and semantic modeling. It also has dropped nine capabilities: automated insights, content management, data source connectivity, metrics layer, natural language generation (NLG), natural language query (NLQ), platform administration, reporting and visualization.
The analytics landscape is transforming from human-driven to agent-driven. This shift, driven by AI agents capable of perceiving, exploring, investigating and acting on data with different levels of human intervention, aims to overcome the scalability and speed limitations of traditional manual workflows.
In response to organizations’ concern about trust, governance and cost control in this scenario of agentic analytics, three new critical capabilities were introduced: agentic insights, analytics governance and semantic modeling. Agentic insights leverage AI agents to autonomously coordinate the data-to-insight process, delivering personalized, explainable insights with governance and auditability, and it is a key capability to equip organizations with deep situational awareness that proactively optimizes outcomes through autonomous or collaborative planning, action and feedback (see How to Adopt Agentic Analytics for Strategic Insights). Analytics governance ensures that analytics content in ABI platforms is securely and compliantly managed through access control, cost observability and life cycle management. Semantic modeling provides a governed abstraction layer for defining and sharing business logic, ensuring consistent, trusted metrics across dashboards, embedded analytics and agentic workflows. These additions address the increasing demand for agentic analytics and the concerns with ROI, trust, governance and cost control.
The other new critical capabilities (conversational analytics and insight delivery) were included to address the need for users to interact with data and agents in natural language, and a container to present insights. Conversational analytics covers both natural language query and generation in an unified way and evaluates how ABI platforms deliver contextual narratives and explanations tailored to their role and needs (see Your BI Platform Isn’t Truly Agentic Yet). These capabilities enable users across the organization to interact with data using natural language, receive contextualized insights and present those insights within an integrated environment.
Additionally, the use cases — perceptive analytics, data storytelling, governance and composable analytics — have been redefined to accommodate changing market dynamics. This redefinition emphasizes the core impact of AI agents in analytics workflows: to deliver context-aware strategic insights and executable recommendations that continuously adapt to business conditions by monitoring and responding to analysis of structured and unstructured data, business events and goals, and user needs.
Note: Last year’s scores should not be compared with this year’s scores.
Analysis
Critical Capabilities Use-Case Graphics
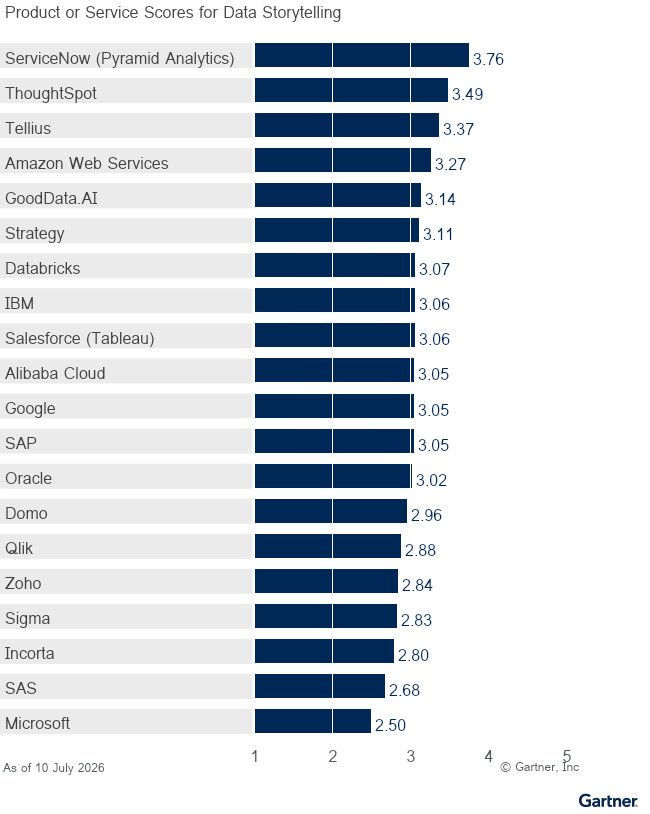
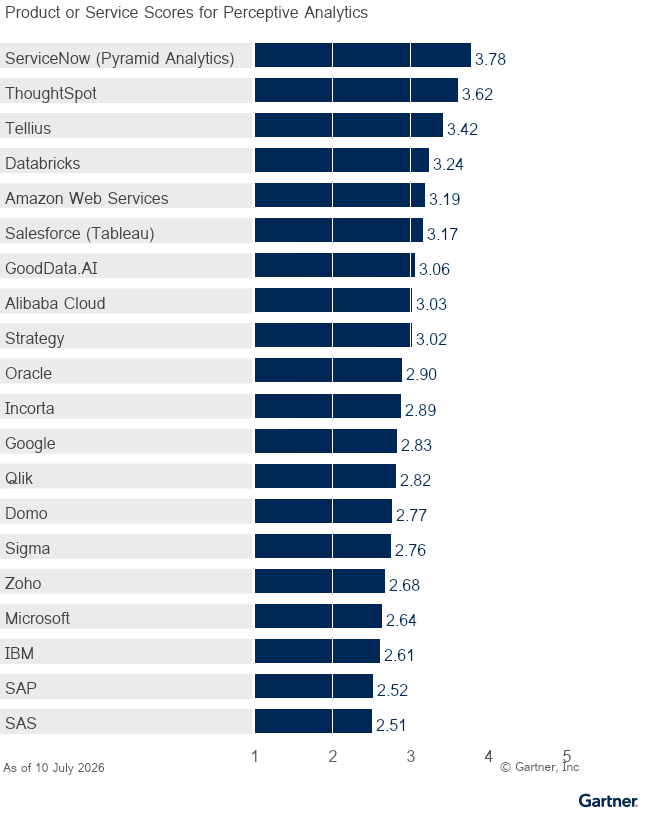
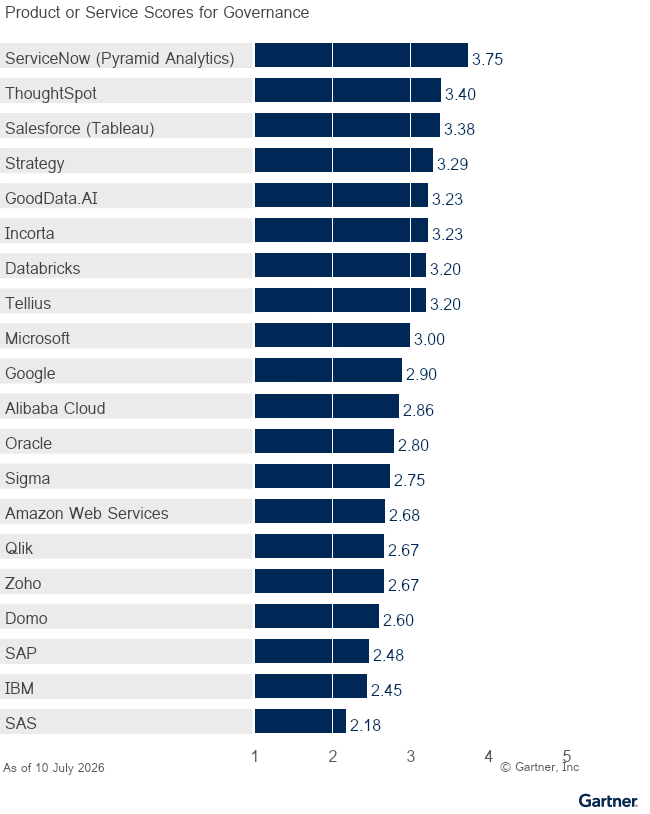
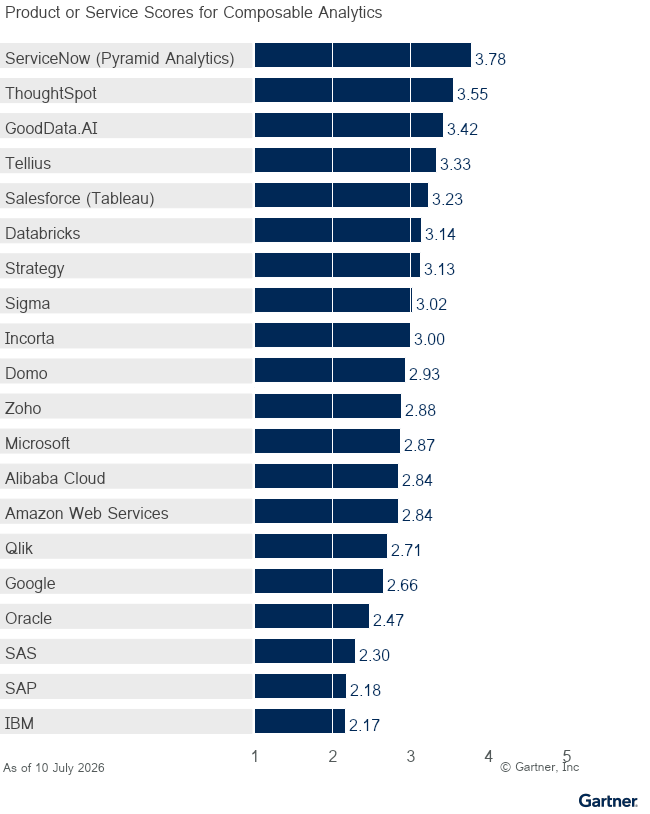
Vendors
Alibaba Cloud
Alibaba Cloud provides Quick BI as its primary analytics and business intelligence platform. While the platform supports on-premises environments and is expanding to additional cloud environments, it is predominantly deployed natively on Alibaba Cloud. The platform includes add-ons like the Smart Q artificial intelligence agent, Quick Index and Data Preparation modules. Quick BI integrates with the broader Alibaba data ecosystem, including Dataphin and MaxCompute. It offers multiple embedding options, providing a JavaScript software development kit and iframe components for integrating interactive analytics into third-party business applications and portals.
The strongest of Alibaba Cloud Quick BI’s capabilities are agentic insights, data preparation, cost observability and conversational analytics. For agentic insights, it utilizes the Smart Q interface to automate data exploration and generate narrative summaries. In data preparation, it provides a proprietary data engine alongside visual interfaces for dataset blending and transformation. For analytics governance, it offers administrative dashboards that track resource consumption and query execution metrics to monitor compute usage. In conversational analytics, it uses a hybrid artificial intelligence stack and domain-specific models to process natural language queries directly within integrated digital workplaces such as DingTalk.
Its biggest opportunities for improvement across its capabilities are analytics catalog, certification and embedded analytics. In the analytics catalog, the platform relies on iframe embedding for third-party business intelligence tools rather than native automated metadata synchronization. For certification, visual badges require manual configuration and do not automatically revoke or notify owners when underlying data schemas change. For embedded analytics, embeddable components are heavily centered on specific regional ecosystems.
Alibaba Cloud Quick BI’s most suitable use case is data storytelling, where it provides functionality for generating narrative-driven analytical content and customized executive briefings. In 2025 and 2026, Alibaba updated core platform capabilities by launching Smart Q, which added conversational data exploration, automated insight summarization and multistep key driver analysis functionalities.
Amazon Web Services
Amazon Web Services (AWS) offers a cloud-based business intelligence service, Amazon Quick, centered on delivering generative analytics and multimodal data integration. The vendor’s technical product strategy focuses on enabling autonomous agents to surface anomalies, key drivers and forecasts across enterprise ecosystems using both structured and unstructured data.
The platform delivers its strongest technical performance across conversational analytics, insight delivery and semantic modeling. Amazon Quick chat agents interpret complex analytical queries involving multistep reasoning and temporal conditions, while retaining conversational memory across sequential interactions. The natural language interface provides real-time query suggestions and type-ahead autocomplete powered by the underlying semantic model, continuously tuning response accuracy through explicit user feedback loops. For insight delivery, the AutoGraph feature dynamically selects optimal chart types as data fields are added, supplementing native visuals with Highcharts integration for customized dashboard development. Users and agents can schedule the distribution of parameterized, pixel-perfect reports, with Quick Flows automating delivery through enterprise communication channels. The semantic modeling layer supports complex aggregate, conditional and window functions, providing an agnostic foundation where Quick Spaces define strict context boundaries to guide accurate agentic reasoning.
Opportunities for further development exist in the platform’s analytics catalog and analytics governance capabilities. Automated catalog population relies on basic metadata scanning rather than utilizing an autonomous engine to continuously crawl, tag and describe existing reports and dashboards. Interoperability with competitive business intelligence tools requires programmatic customization and reliance on partner solutions, lacking native connectors to automatically harvest metadata from external platforms. The platform lacks an advanced collaborative filtering engine capable of personalizing the discovery of analytical assets based on peer behavior and historical usage patterns. Within analytics governance, the content certification strategy depends heavily on folder management structures rather than providing prominent, centralized watermarks or badges directly on the visual assets. Managing the development, testing and production life cycles of these analytical assets often requires integrating AWS Lambda functions, creating a promotion process that operates outside the core business intelligence interface.
Amazon Web Services’ strongest use case is data storytelling. This alignment is driven by the platform’s foundation in conversational analytics and seamless insight delivery. The integration of conversational chat agents that maintain multiturn memory, paired with the ability to autonomously generate and distribute highly formatted, parameterized reporting, enables organizations to effectively construct, contextualize and share data-driven narratives across their user base.
Databricks
The Databricks platform centers its analytical vision on providing a conversational-first experience through Genie. The technical product strategy focuses on establishing enterprise context through semantic learning, where the platform monitors metadata, query history and related assets to support multiagent workflows. This architecture integrates Genie directly into the data modeling experience, enabling users to develop content while maintaining governed business semantics.
The platform delivers solid technical capabilities across data preparation, semantic modeling and analytics governance. Within data preparation, Lakeflow Connect and built-in artificial intelligence functions automatically extract and structure content from multimodal sources, while Unity Catalog volumes manage nontabular assets. Lakeflow Designer provides a visual, drag-and-drop interface for building repeatable pipelines, utilizing the underlying knowledge graph to recommend joins and suggest data transformations. For semantic modeling, Unity Catalog Business Semantics enables developers to define complex calculations once using Metric Views, which are then accessible across dashboards, notebooks and external applications. Genie Code supports this process by providing agentic authoring for measures and dimensions. Governance features are deeply integrated into the architecture, with Unity Catalog enforcing attribute-based access controls, row-level filters and column masks across all defined scopes. System tables capture comprehensive telemetry on compute utilization and token consumption, allowing administrators to monitor platform health and optimize query performance conversationally.
Opportunities for enhancement exist in the platform’s analytics catalog capabilities, particularly regarding automated population and business user accessibility. While the system provides AI-suggested descriptions for database objects like tables and schemas, it lacks an autonomous engine capable of crawling and generating descriptions for front-end reporting assets and dashboards. Business users may face friction when attempting to edit metadata, as modifying object comments requires elevated technical privileges rather than operating as a seamless self-service function. The platform relies on custom coding and application programming interfaces to ingest external data lineage, lacking prebuilt automated connectors to natively catalog analytics content from competitive tools. Several cataloging features, including certification system tags and a dedicated discovery interface, remain in preview or beta stages rather than functioning as generally available capabilities.
The platform’s architectural focus on governed data preparation, centralized semantic definitions and robust multistep agentic workflows makes it well-suited for perceptive analytics use cases. By unifying data engineering pipelines with a knowledge graph that continuously learns from usage patterns, the system equips conversational agents with the deep contextual awareness required to autonomously analyze trends, detect anomalies and generate transparent, source-cited insights.
Domo
The Domo AI and Data Products Platform delivers on its vision of making analytics accessible directly at the data’s location, without the need to move or copy data. It features a library of over 1,000 data connectors that allow integration with a wide variety of data sources, including ERPs, CRMs, productivity tools and CDWs. The platform’s focus on data products and apps empowers users to turn data and insights into reusable assets that can drive standardization at scale for specific business outcomes.
Domo’s most competitive capabilities are embedded analytics and data preparation. In embedded analytics, Domo offers Domo Everywhere, which allows organizations to curate, view and edit analytics assets into third-party portals and applications, with full interactivity and customization, and object-level and row-level security. Domo also offers the ability to connect AI tools (e.g., Cloud Code, Cursor, VS Code, ChatGPT) to Domo using Model Context Protocol, allowing users to query data and documents, global search, and card or page summarization. In data preparation, Domo’s Magic ETL offers a visual representation of repeatable data pipelines and steps for blending, transforming and enriching data in a very business-user-friendly way. Moreover, Domo offers comprehensive autogenerated data profiling information with statistics on data quality, completeness and distribution. Users can view autogenerated standard statistics, aggregations, correlations and distribution histograms. It also includes a vision of the health of all data sources in their entire Domo instance.
Its biggest opportunities for improvement are semantic modeling and agentic insights. In semantic modeling, its capabilities as an agnostic layer are constrained by limited multiconsumer support and the absence of native query optimization. The platform requires the user to configure a Domo AI workflow to automate AI agents for generating, refining, documenting or validating semantic definitions and relationships. For agentic insights, Domo offers basic proactive and automated key driver analysis. The discovery process is user-initiated through natural language prompts or automated using workflows, which can provide proactive agent-driven root cause analysis. Additionally, it provides low-code clustering capabilities in Magic ETL that require manual configuration, while automated action suggestions can be set up using the AI Agent task in workflows. More advanced and automated clustering (or other analytics) is available via Domo’s Jupyter Workspaces or Domo Workflows.
Domo’s most suitable use case is data storytelling, driven by strong conversational analytics and insight delivery capabilities, indicating its ability to combine interactive data visualizations with narrative techniques to generate and deliver insights in compelling, easily assimilated forms. The platform dynamically generates narratives that adapt to user roles. Its native global search and Alert Center utilize intelligent algorithms to recommend content tailored to a user’s specific persona, role and historical usage pattern, actively surfacing information that peers are viewing.
GoodData.AI
GoodData.AI offers a cloud-based and on-premises data and AI application platform that provides a governed semantic execution layer for AI agents, and centralizes insight development by applying software engineering practices to analytics delivery. Its technical product strategy emphasizes an analytics-as-code architecture, utilizing components such as AI Skills for automating analytics capabilities, AI Memory and AI Knowledge for injecting context and steering AI behavior, FlexConnect for dynamic data connectivity, FlexQuery for live query optimization, and FlexCache for high-performance compute.
The GoodData.AI platform delivers strong technical capabilities across embedded workflows, semantic modeling and analytics catalog. The platform provides a headless semantic layer that serves business intelligence, data science, and external software-as-a-service applications and AI agents through extensive APIs, software development kits (SDKs) and Model Context Protocol servers. Developers utilize the Logical Data Model (LDM) Modeler to blend data and map source structures into the semantic layer, ensuring consistent metric definitions and row-level security across native and embedded experiences. The analytics catalog natively supports the automated ingestion of assets from external business intelligence tools and provides governance and enrichment of objects available to AI. These governed assets can support agentic workflows in which the Agentic AI Assistant uses metadata, multistep reasoning and analytical skills through an explainable chat interface. AI-assisted workflows automate the migration of external dashboards and metrics directly into the platform’s governed semantic layer to centralize enterprise metadata management.
Opportunities for capability development exist in the platform’s agentic insight capabilities, specifically regarding autonomous discovery of key driver insights and scenario modeling. While the platform successfully identifies context-specific outliers and meaningful data clusters, these features operate primarily as analytical outputs requiring manual user prompting or static alert configurations. The system lacks a fully autonomous engine capable of dynamically routing escalations, prescribing direct remediation actions or pushing targeted actions into downstream activation systems based on segmented data. Users can model alternative business outcomes side-by-side using agent-driven parameter adjustments for scenario analysis. The underlying architecture does not provide mechanisms to calculate probabilistic uncertainty ranges or track actual outcomes against modeled plans for long-term variance analysis. Content discovery mechanisms leverage role context and trending workspace activity to surface analytical assets, but the interface does not provide transparent explanations detailing the specific logic or behavioral signals driving those individual recommendations.
GoodData.AI’s strongest supported use case is composable analytics. The platform’s foundational architecture heavily prioritizes headless data access and embedded analytics. Providing developers with a robust suite of programming interfaces and a universal semantic layer allows organizations to seamlessly inject highly customized, modular analytics components, tools and agents into existing digital environments and operational workflows, while maintaining centralized code-centric governance.
Google’s Looker is a comprehensive platform for data-driven decision making and a centralized and open semantic layer (LookML) that acts as the single source of truth. In 2026, Google simplified its packaging under a single Looker strategy: Looker platform as the enterprise standard and Data Studio as a free visualization workbench. Google offers Looker in three platform editions: Standard for small teams, Enterprise with enhanced security for internal analytics, and Embed for large-scale external analytics.
Looker’s strongest capabilities are analytics governance and insight delivery. For analytics governance, Looker’s certification framework maintains a single source of truth by assigning distinct trust levels. This system automatically revokes certified badges if the underlying content is edited, preventing multiple versions of the truth. Looker utilizes native git-based version control for its semantic model and dashboards, supporting versioning, multienvironment life cycles and continuous integration testing before promotion. For insight delivery, Looker supports high user concurrency by managing usage spikes with elastic resource allocation and robust high-concurrency architecture. Looker also provides strong GenAI capabilities that leverage language into customized analytics content and specific visualization formats, facilitating the creation of reports and dashboards.
Its biggest opportunities for capability improvement are data preparation and analytics catalog. In data preparation, Looker leverages unified integration with Google Cloud tools such as Knowledge Catalog for visual data lineage and statistical profiling, prioritizing an ecosystemwide approach over a visual representation of the sequential data transformation steps within the native application. Furthermore, the platform falls short in automatically inferring data hierarchies natively, while prioritizing code-first precision. For the analytics catalog, while Looker provides basic automated semantic population, it offers flexible external enterprise integrations for comprehensive cataloging. Looker’s native catalog prioritizes deep integration with the Google Cloud stack over prebuilt connectors or automated synchronization designed to extract and catalog reports, dashboards or metrics from third-party platforms, which positions it as a specialized platform-agnostic portal.
Looker’s most suitable use case is data storytelling, demonstrating a strong capability to present insights in easily digestible formats by blending interactive data visualization with narrative techniques. Looker’s strong conversational analytics capability enables users to interact with data through natural language and receive contextual storytelling, empowering business users to generate dynamic insights. Looker surfaces content based on individual favorites, group popularity and organizational trends, employing AI semantic search to match the conceptual meaning of natural language queries.
IBM
IBM provides Cognos Analytics as its primary analytics and business intelligence platform. It can be deployed as public cloud SaaS, on-premises or via certified containers in Kubernetes environments. It includes components like the watsonx BI agent and the IBM Analytics Content Hub. The platform integrates with enterprise data catalogs such as IBM Watson Knowledge Catalog and supports open metadata standards like Egeria. It offers embedding options, providing application programming interfaces for integrating reports and dashboards into custom business applications and portals.
The strongest of IBM Cognos Analytics’s capabilities are agentic insights, analytics catalog, data inference and insight delivery. For agentic insights, it offers discovery and explanation through native analytics agents that help users find, understand, create and share reports using natural language, as well as automated key driver detection, ranked impact analysis and conversational drill-down through the watsonx BI agent. In the analytics catalog, it features native connectors through the IBM Analytics Content Hub to ingest and display content from third-party business intelligence platforms alongside its own reports. For data inference, it utilizes artificial intelligence to automatically infer relationships, detect data types, suggest hierarchies and generate semantic models based on keyword searches. In insight delivery, it enables users to schedule report distribution, export to multiple formats and subscribe to regular updates.
Its biggest opportunities for improvement across its capabilities are semantic modeling, embedded analytics and multimodal data integration. In semantic modeling, the platform relies on semantic inference engines but lacks connections to external knowledge graphs and does not incorporate unstructured content natively. For embedded analytics, Model Context Protocol support configurations are tied to the separate watsonx BI offering and rely on external developer environments rather than being fully integrated into the core platform. In agent workflow orchestration, it provides native agentic workflows for analytics agents but still requires external orchestration engines to execute cross-system automation tasks. For multimodal data integration, the platform lacks native capabilities for processing and analyzing unstructured data formats directly within the analytical workflow.
IBM Cognos Analytics’ most suitable use case is data storytelling, where it provides functionality for identifying key drivers, generating natural language narratives and distributing scheduled reports. In 2025 and 2026, IBM updated core platform capabilities by introducing certified containers for flexible cloud deployment and adding conversational reporting agents to assist users in summarizing and sharing analytical content.
Incorta
Incorta offers a near-real-time operational analytics platform designed to bypass traditional dimensional modeling and data transformation through its Direct Data Mapping technology. The vendor’s technical product strategy positions the platform as a comprehensive data foundation for analytics and decision intelligence. The technical vision emphasizes unifying complex enterprise data from systems like SAP and Oracle into a single operational lakehouse, equipping organizations with scalable, high-fidelity data access to drive operational workflows and analytics applications without latency.
The platform delivers its strongest technical performance in analytics governance and data preparation. Incorta secures content and prevents disjointed definitions by enforcing granular controls across four distinct layers, including row-level security inherited directly from source systems and object-level permissions. Administrators can apply strict data classification rules to enable column-level masking and encryption for designated user groups. The platform fosters a crowdsourced trust layer, allowing users to rate, review and report quality issues on certified business views, schemas and dashboards. For life cycle management, Incorta provides built-in version history, visual comparison tools to identify changes across versions and granular rollback capabilities for all analytical assets. Within data preparation, the Direct Data Mapping architecture provides a no-code logical layer that combines complex enterprise sources at query time. The Schema Wizard automatically detects self-joins to surface hierarchies, while the Data Quality suite and Incorta Data Profiler deliver deep statistical profiling, distribution metrics and quality scores directly within the user workflow.
Opportunities for growth are present within the platform’s analytics catalog interoperability and insight delivery. Incorta lacks native, prebuilt connectors to automatically ingest, synchronize and catalog analytics content from competitive analytics and business intelligence platforms. The platform’s content recommendation engine relies on intent matching based on users’ questions rather than utilizing proactive algorithms to autonomously recommend personalized, persona-aware content based on peer behavior. Within insight delivery, generating highly formatted, traditional pixel-perfect reports requires the customer to purchase the optional data integration service. The conversational analytics interface requires administrators to manually enter synonyms into metadata definitions or craft trusted reference queries, lacking an autonomous artificial intelligence engine that continuously learns and adapts terminology based on user feedback loops.
Incorta’s strongest supported use case is governance. This alignment is driven by the platform’s foundation in analytics governance and robust data preparation. The combination of comprehensive, layered security; deep statistical data profiling; crowdsourced certification workflows; and life cycle management enables organizations to maintain strict oversight, security and trust across their entire analytical data pipelines and reporting environments.
Microsoft
Microsoft provides Power BI as its primary analytics and business intelligence platform. Power BI operates as the ABI workload within the broader Microsoft Fabric environment and integrates with Azure, Microsoft 365 and collaboration tools such as Microsoft Teams. It is delivered primarily as public cloud SaaS, alongside Power BI Desktop for authoring and Power BI Report Server for on-premises requirements. In the capabilities assessed here, Power BI emphasizes governed semantic models, report and dashboard authoring, embedded experiences, and AI-assisted workflows for search, summarization and development support. Fabric users can also access adjacent services such as Dataflows Gen2, OneLake integration for semantic models and Fabric IQ.
Microsoft Power BI’s strongest capabilities are semantic modeling, analytics governance, embedded analytics and data preparation. In semantic modeling, it provides a governed semantic model layer with support for complex expressions and API extensibility. In analytics governance, it provides deployment pipelines for managing analytics assets across development, test and production environments. For embedded analytics, it offers a MCP remote server that allows AI agents to query semantic models and generate queries through development tools. In data preparation, it profiles data leveraging Power Query and Dataflows Gen2 to surface column quality, distributions and statistics. Fabric users can also extend these capabilities through broader data and semantic services.
Its biggest opportunities for capability improvement are analytics catalog and conversational analytics. In the analytics catalog, the platform demonstrates outbound metadata sharing but lacks the native ability to ingest and catalog analytics content from competing BI tools, although users can apply governance and catalog capabilities through the OneLake catalog and third-party integrations in Fabric. In conversational analytics assessed in this research, the platform offers limited support for advanced multistep reasoning and cross-domain reasoning, even though Fabric users can access adjacent services such as data agents outside the scored ABI workflow. For contextualization of data stories, capabilities remain constrained by the absence of formal persona management, policy rules and user preference tracking in the assessed experience.
Microsoft’s strongest supported use case is governance, reflecting strong alignment with organizations that prioritize standardized metrics, lineage, certification and controlled promotion of analytics assets. This is supported by certification and endorsement of content, lineage and impact analysis, workspace-based access controls, and life cycle practices for managing assets across environments. Fabric users can also use the OneLake catalog to explore, govern and secure assets across the wider environment.
Oracle
Oracle Analytics Cloud (OAC) enables organizations to integrate and analyze data from diverse sources and leverage Oracle’s latest artificial intelligence innovations. The platform features a powerful AI assistant that facilitates self-service across the analytics content workflow. Oracle also offers Analytics Cloud within the Oracle Fusion Data Intelligence stack, which includes ready-to-use packaged analytics apps built specifically for Fusion Cloud Applications. OAC applies several AI features to assist users in integrating diverse data types, including structured or unstructured multidimensional data, documents and images.
The strongest of Oracle’s capabilities are data preparation and insight delivery. In data preparation, OAC provides an exceptional visual, drag-and-drop data flow designer that represents the repeatable pipeline for transforming, blending and enriching data. It applies AI to automatically infer relationships, data types and complex hierarchies. OAC automatically profiles data on load, generating high-quality visual summaries, histograms, missing values detection and suggestions for data cleaning directly within the preparation interface. In insight delivery, it offers a strong visualization environment that natively supports charting library integrations, comprehensive custom marketplace distribution and advanced geographic mapping features, and an interactive experience enabling consumers to dialogue with their dashboards. OAC delivers robust parameterized reporting, integrating interactive dashboards, pixel-perfect design and dependent filtering to accommodate high user concurrency with elastic scaling.
OAC’s biggest opportunities for capability improvement are embedded analytics and semantic modeling. For embedded analytics, configuring write-back to applications can be complex and may require a significant amount of manual setup. Its agent workflow orchestration is currently centered around data actions and triggers, with more limited support for fully autonomous management of complex tasks. In semantic modeling, OAC does not yet fully leverage AI agents to generate, document, refine or validate enterprise semantic models or metrics. Its context awareness capability, despite supporting dynamic semantic inference and the referencing of unstructured instructional content, does not yet support knowledge graph technology.
Oracle’s most suitable use case is data storytelling, indicating its capacity to combine interactive visualization with narrative techniques to generate and deliver insights in compelling forms. The platform delivers a premier AI-enabled dashboard development experience, translating natural language into tailored visuals while accommodating specific corporate themes, natively supporting charting library integrations. It also provides comprehensive parameterized reporting, integrating interactive dashboards, pixel-perfect design and dependent filtering. The automated catalog population ensures new content is registered and described promptly, advancing collaboration and content relevance across the platform.
Qlik
Qlik provides a cloud-based analytics platform centered around its Qlik Cloud Analytics solution. The vendor’s technical product strategy focuses on delivering a unified environment for data integration, transformation, quality, analytics and artificial intelligence. The technical vision emphasizes an agentic architecture, where Qlik Answers connects across multiple specialized agents to become a single, ambient interface for uncovering insights from both structured and unstructured data.
The platform delivers its strongest technical capabilities across insight delivery, data preparation and agentic insights. Qlik supports custom visualization development through Nebula.js, a framework-agnostic library that enables seamless integration of custom charting libraries. Insight delivery is strengthened by Qlik Reporting Services, which distribute parameterized, pixel-perfect PDF and Office documents from governed templates. Within data preparation, the Qlik Analytics Engine automatically detects relationships, data types and hierarchies while providing visual data flows to map how datasets are combined, cleansed and optimized. Qlik Data Products automatically profile datasets during ingestion to surface statistics on data quality, completeness, distribution and lineage. For agentic insights, the Discovery Agent operates autonomously in the background to identify meaningful data shifts and push multidimensional explanations directly to the user. The Qlik Answers interface leverages a swarm architecture to decompose complex questions, utilize semantic search, and dynamically generate dashboards or visualizations based on the user’s intent.
Opportunities for capability development exist within the platform’s analytics catalog, analytics governance and conversational analytics. The native analytics catalog lacks the capability to ingest and index analytical content from external platforms, relying on third-party governance tools or custom application automation workflows to bridge these gaps. Content discovery and recommendation mechanisms do not utilize advanced collaborative filtering to dynamically adapt content rankings based on learned peer behavioral patterns over time. Within analytics governance, the platform relies on shared and managed spaces to move analytical assets, lacking a native, intuitive visual interface for administrators to seamlessly manage strict version control and execute rollbacks across distinct development, testing and production environments. For conversational analytics, the platform offers basic support for persona management and does not currently support persona-based policies or user preference tracking. Although Qlik delivers proactive and personalized query suggestions based on historical context, it does not currently support real-time autocomplete, compound phrase prediction or alternative UI suggestions while typing.
Qlik’s strongest supported use case is data storytelling. The platform’s foundation in insight delivery and agentic capabilities drives this alignment. By combining a swarm-based generative interface capable of dynamically assembling visualizations with an autonomous discovery engine that continuously surfaces underlying metric drivers, organizations can effectively craft, contextualize and distribute comprehensive data narratives.
Salesforce (Tableau)
Tableau, a Salesforce company, provides a stand-alone analytics and business intelligence platform centered around agentic capabilities and visual data exploration and semantic modeling. The platform supports cloud and on-premises deployments. Recent updates include the introduction of a publicly available Model Context Protocol server and the integration of the stack-agnostic Agentforce Trust Layer to enforce security controls over semantic data models.
The strongest Tableau capabilities are data preparation, analytics governance and embedded analytics. In data preparation, it offers a visual flow pane that automatically profiles data during transformation, allowing users to see the downstream impact of joins and filters. For analytics governance, it supports content certification workflows and maps data lineage across metrics, pipelines and dashboards. In embedded analytics, the platform integrates into digital workplaces such as Slack and Microsoft Teams while providing application programming interfaces for third-party application embedding.
Its biggest opportunities for improvement across its capabilities are interoperability, scenario analysis and bring-your-own-model flexibility. In interoperability, the platform focuses on building a catalog from internal content rather than natively cataloging external reports from third-party vendors. For scenario analysis, while it provides fundamental what-if parameter adjustments, it lacks a dedicated multivariable scenario builder or automated sensitivity analysis. In bring-your-own-model flexibility, although it connects to external large language models, it lacks administrative configuration controls to specify which model is invoked per feature or use case.
Tableau’s strongest support use case is governance. This reflects the platform’s capacity to manage complex enterprise deployments through centralized metadata, strict security protocols and comprehensive life cycle management. Administrators can utilize features such as data quality warnings, certification badges and data lineage tracking to ensure users access verified information. The architecture supports fine-grained access controls and provides observability tools to monitor platform utilization and performance effectively.
SAP
SAP’s Analytics Cloud is offered as part of SAP Business Data Cloud (BDC), a fully managed SaaS solution for data, analytics and AI that unifies and governs all SAP data and connects with third-party data. BDC integrates the functionalities of SAP Datasphere, SAP Analytics Cloud and SAP Business Warehouse. BDC is supported by the Joule conversational assistant for natural language querying.
SAP offers strong insight delivery and analytics governance capabilities. The platform’s insight delivery capabilities include generating branded dashboards using natural language. It allows for the creation of custom visualizations by integrating interactive charting libraries and providing visualization guidance, and it also supports specifying visualizations natively. In analytics governance, SAP offers robust life cycle management with version control and the transport of content packages among dev/test/prod environments. Any analytics asset can be version-controlled, from stories to semantic models, with complete version history and rollback mechanisms. Additionally, it allows users to track data lineage from source systems, including non-SAP, to dashboards or other consumption methods.
The platform’s biggest opportunities for capability improvement are semantic modeling and embedded analytics. In semantic modeling, the platform falls short in serving as an agnostic layer capable of serving diverse analytics and business intelligence (ABI) platforms. Furthermore, the platform’s context awareness offers limited support for connecting knowledge graphs. For embedded analytics, native write-back capabilities are restricted to the internal SAP ecosystem, focusing on SAP HANA, SAP BW and specific planning applications. Its agent workflow orchestration relies on highly complex, human-mapped flows built in SAP Build, rather than offering true autonomous or semiautonomous task orchestration natively within the core analytics platform.
SAP’s strongest use case is data storytelling, leveraging its powerful capabilities to merge interactive data visualization with narrative approaches, delivering insights in a contextualized way. Through its Smart Insights capabilities, the platform automatically generates textual natural language explanations combined with visualizations to help users understand the top contributors driving a specific data point. The Smart Insights agent automatically surfaces key drivers that are contributing to a change in the data, empowering business users to quickly grasp complex fluctuations without requiring deep technical knowledge.
SAS
SAS offers SAS Visual Analytics via its SAS Viya platform. SAS Visual Analytics is a cloud-based platform designed for data exploration, analysis and visualization. It provides users with tools for creating interactive dashboards and reports supporting a range of analytics needs, from basic data discovery to more advanced analysis. The platform is built to be scalable and integrates with other SAS Viya offerings, aiming to facilitate collaboration and data-driven decision making within organizations.
The strongest of SAS’s capabilities are insight delivery and data preparation. For insight delivery, SAS Viya empowers users with highly formatted, parameterized dashboards and pixel-perfect parameterized reporting. It delivers extensive functionality for interactive visualizations via complex multiparameter filtering and natively integrates AI-enabled forecasting directly into its reasoning engine to reliably manage core reasoning and temporal algorithms. In data preparation, SAS Viya provides robust automated data profiling summaries generated instantly upon data import. The platform accurately detects data types and produces comprehensive statistical summaries, including distinct value counts, frequency distributions, histograms and range analysis. Users can intuitively explore distributions and identify outliers directly within the modeling interface without needing external tools.
Its biggest opportunities for capability improvement are semantic modeling and analytics catalog. In semantic modeling, the platform’s context awareness capability lacks support for automated semantic inference, unstructured content referencing and formal knowledge graphs. For the analytics catalog, the platform lacks interoperability and cannot ingest and index analytics content from competitive business intelligence tools. Additionally, SAS Viya’s analytics catalog does not support AI-automated catalog population (e.g., crawling through content and describing the reports, dashboards and metrics).
SAS excels at data storytelling by effectively combining agentic insight generation and delivery. The platform provides robust responsible insight generation by offering interactive explainability, detailed fairness and bias metrics, and information privacy warnings. SAS automatically displays “information privacy icons” next to sensitive data items as a warning to authors to evaluate potential data imbalances that might lead to biased analyses or models. It also offers strong capabilities across parameterized reporting, enabling users to build pixel-perfect reports, interactive dashboards and dependent parameter filters.
ServiceNow (Pyramid Analytics)
Pyramid Analytics offers a cloud-based business intelligence solution known as a Decision Intelligence Platform. The technical product strategy focuses on delivering AI-driven applications. The vendor’s recent innovations include the ability to vectorize customer data and enable the creation of agents to autonomously perform complex analytical routines with dedicated Agent Designer and Bot Wizard capabilities. The vision includes the creation of insight-to-action experiences leveraging Pyramid’s capabilities for descriptive, predictive and prescriptive analytics and ServiceNow’s agentic action and workflow capabilities.
The platform delivers robust technical capabilities across data preparation, conversational analytics and embedded analytics. The graphical Master Flow interface allows users to construct logical steps to cleanse and enrich datasets. An AI Data node extracts structured outputs from unstructured modalities such as video, audio and images. Built-in large language model widgets support sentiment analysis and translation directly within the data pipeline. Smart Model automatically detects tables, joins, data types and hierarchies to accelerate modeling. The conversational analytics capability features a stateful, multistep chatbot interface that automatically localizes language, tone and verbosity preferences. The natural language querying capability guides users with real-time suggestions, autocomplete functionality and proactive follow-up questions derived from organizational activity. Embedded workflows are supported by an Embed Hub that injects customizable content into host applications via APIs and SDKs. Pyramid’s Tabulate spreadsheet interface combines live data, static values and formulas with the Solve optimization engine, enabling users to write data back to target systems. Administrators can leverage a multimodel strategy, assigning distinct language models from external providers to specific semantic models to handle varied workloads.
Opportunities for further development exist within the platform’s agentic insight capabilities, specifically regarding autonomous discovery, anomaly remediation and scenario modeling. While Agent Designer and Bot Wizard support the construction of autonomous agents, organizations must configure and manage these to realize continuous discovery, key driver analysis and action workflows. Pyramid’s Solve optimization engine handles complex what-if modeling, but it requires users to manually configure constraints and variables. User experience would be improved if customers could utilize an agent to proactively build multivariable scenarios from a natural language prompt.
Pyramid’ strongest supported use case is perceptive analytics. The platform’s strong foundation in conversational analytics and semantic modeling drives this alignment. Providing a highly adaptive natural language interface, centralized metric governance and multistep reasoning capabilities allows organizations to interrogate their data deeply and extract actionable insights through context-aware workflows.
Sigma
Sigma offers a cloud-based business intelligence platform featuring a spreadsheet-like interface and live querying directly against cloud data warehouses that eases adoption for users familiar with traditional spreadsheet applications. The technical product strategy focuses on allowing customers to build and customize their own artificial intelligence applications.
The platform delivers its strongest capabilities in embedded analytics and conversational analytics. Sigma enables data modifications through its Input Tables feature, allowing data writeback via a dedicated, isolated schema utilizing an append-only write-ahead log directly to the cloud data warehouse. This architectural approach ensures edits are nondestructive row-level inserts tagged by user identity, primary key and time stamp, without modifying underlying production tables. The Sigma Actions Framework and Sigma Agents execute conditional, multistep sequences by triggering API calls, stored procedures and data writebacks to orchestrate tasks across cloud data warehouses and external platforms such as Salesforce and ServiceNow. For natural language querying, the Sigma Assistant interface processes complex multistep reasoning, filtering, aggregations and temporal logic into SQL, while retaining conversational context for iterative follow-ups. The formula assistant guides query construction using type-ahead and autocomplete functionalities. The platform personalizes content delivery through role-based homepages and team recommendations driven by usage data and social signals.
Opportunities for growth are present within the platform’s agentic insights and analytics catalog capabilities. Sigma supports scenario modeling though Input Tables, Sigma Agents, stored procedures and Python elements, with Python running as a native element inside Sigma. Advanced probabilistic forecasting may require customer-defined statistical models or libraries, rather than manual construction and integration of external data science models. Anomaly detection and key driver identification mechanisms rely on Sigma Assistant and predefined scheduled runs of Sigma Agents that can operate as continuous background engines that autonomously surface and rank drivers. The analytics catalog relies on automated metadata syncing from the underlying cloud data warehouse and lacks native automated ingestion to map existing reports into the catalog. Extracting metadata from competitor platforms is achieved using the Sigma BI Analyst App, which functions as a partner-built third-party application rather than a native ingestion connector.
Sigma’s strongest supported use case is composable analytics. The platform’s foundation in embedded workflows and semantic modeling drives this alignment. The integration of advanced write-back functions, bidirectional function calling via secure iframes utilizing APIs and SDKs, and the ability to orchestrate actions across external applications enables organizations to construct modular, customizable data applications within broader digital ecosystems.
Strategy
Strategy (formerly MicoStrategy) offers an open and composable solution that enables organizations to deliver governed analytics at scale. It maintains a cloud-first approach supporting major cloud providers and delivers an open governed semantic layer that leverages data across any source to provide consistent business context across any analytics tool or AI agent. It features an open, composable architecture designed to support technology stack flexibility. It offers a range of connectors, a suite of APIs and native cloud compatibility with major cloud providers. This enables integration with both existing and emerging technology environments, allowing organizations to access advancements in AI as they become available.
The strongest of Strategy’s capabilities are insight delivery and semantic modeling. For insight delivery, the platform excels in parameterized reporting by natively combining interactive dashboard design, pixel-perfect layouts and sophisticated multiparameter filtering. It effortlessly accommodates high user concurrency with elastic resource scaling and pairs automated visualization recommendations with full custom marketplace support. In semantic modeling, Strategy delivers a strong AI-enabled workflow that seamlessly generates models, metrics and documentation, tightly governed by a human-in-the-loop certification process. It serves as a fully agnostic layer equipped with comprehensive third-party connectors, efficient query optimization and modern AI integration standards.
Its biggest opportunities for capability improvement are analytics catalog and data preparation. For the analytics catalog, while it provides a moderate level of native metadata management, it relies entirely on custom Python coding and manual library setup rather than native, prebuilt connectors to automatically harvest metadata and establish ongoing synchronization with external competitive BI platforms. This significantly limits interoperability for enterprisewide cataloging. For data preparation, the platform lacks a visual pipeline mapping of sequential transformation steps. Instead, the data pipeline only presents a list of the transformations and actions undertaken. Additionally, unstructured data support is limited; native support for analyzing video, audio and social media is not currently available, requiring external API integration to process these formats.
Strategy’s most suitable use case is governance, indicating its strong capabilities to secure content and manage the development life cycle, enabling organizations to scale analytics in a governed way. Mosaic Sentinel provides centralized security monitoring, auditing who accessed which content and flagging anomalous activity, offering strong logging/audit capabilities with an excellent level of granularity, visibility on model adoption and data consumption. Strategy supports full dev/test/prod life cycle management. Change Journal provides versioning with user/time stamp audit trails, and role-based permissions and package certification enforce approval policies.
Tellius
Tellius provides an analytics and business intelligence platform centered around agentic analytics and automated semantic modeling, with deep specialization in the pharmaceutical and consumer packaged goods sectors. The platform uses its AI assistant, Kaiya, to provide a natural language interface for data exploration, semantic modeling and cataloging. It supports both cloud and on-premises deployments. Recent updates include a browser extension that overlays conversational capabilities onto third-party web applications and the addition of a publicly available Model Context Protocol server for external AI agent integration.
The strongest Tellius capabilities are semantic modeling, conversational analytics and insight delivery. In semantic modeling, the platform automatically infers schemas, generates synonyms and allows business users to bulk-generate metadata fields using human-in-the-loop review, and joins structured data with unstructured sources (including call notes, contracts and documents) at the semantic layer for queries that span both. For conversational analytics, it processes complex analytical queries using multistep reasoning and retains conversational memory. For insight delivery, the system manages scheduled distributions and multiformat exports for dashboards while supporting interactive visual features.
Its biggest opportunities for improvement across its capabilities are analytics catalog, analytics governance and data preparation. For analytics catalog interoperability, Tellius offers semantic-layer integration with Looker and dbt via an open YAML format, embeddable surfaces (Vizpads, Insights, Search, Kaiya, Feed) via iframe with programmatic controls, REST APIs, a Model Context Protocol server and a Kaiya Browser Extension. However, it does not currently provide prebuilt connectors to ingest reports or dashboards from competing BI platforms into its own catalog. In the analytics catalog, moving analytics content between development and production spaces requires users to manually download and upload the assets, which introduces governance constraints. For data preparation, the platform processes text-based files such as transcripts and documents but does not currently support the direct ingestion of video or audio formats.
Tellius’s strongest supported use case is perceptive analytics, indicating its suitability for organizations that require intuitive data discovery and automated insights. This reflects the vendor’s abilities in conversational analytics and semantic modeling. Users can utilize natural language to execute analytical goals, which the system breaks down into sequenced SQL or Python execution plans while retaining conversational context. The platform supports AI-driven metric creation and generates dashboards from text prompts while accommodating specific corporate themes.
ThoughtSpot
ThoughtSpot provides its primary analytics and business intelligence platform natively as public cloud software as a service. The platform is delivered natively across multiple cloud service providers rather than relying on containerized deployment approaches. Its core components include Spotter, ThoughtSpot embedded and a patented semantic layer. The platform also offers extensive application integration capabilities, utilizing SDKs, APIs and the Model Context Protocol for embedding interactive analytics and custom actions into third-party business applications and portals.
The strongest of ThoughtSpot’s capabilities are embedded analytics, semantic modeling and conversational analytics. For embedded analytics, its function calling supports composability through SDKs and the Model Context Protocol to embed analytical components, external agent skills and custom two-way event triggers into external applications, alongside native reasoning capabilities such as support for “why” questions in Spotter to explain drivers behind changes in data. In semantic modeling, the platform leverages AI to automatically infer full semantic schemas, metrics and documentation while enforcing human-in-the-loop oversight. For conversational analytics, multistep reasoning allows context-aware processing, complex query decomposition and cross-asset reasoning. It also offers suggestions and type-ahead, providing an autocomplete engine that offers compound phrase prediction, real-time query alternatives and personalized query recommendations.
Its biggest opportunities for improvement across its capabilities are analytics catalog and insights delivery. In the analytics catalog, the platform can import metric layers from data platforms like Snowflake or Databricks, but lacks prebuilt connectors to natively extract, synchronize and catalog external reports from competitive business intelligence tools. In insight delivery, it facilitates standard dashboard distribution but does not provide pixel-perfect report authoring. It offers automated alerts and subscription management with fundamental capabilities.
ThoughtSpot’s most suitable use case is perceptive analytics, where it provides functionality for ad hoc data exploration, search-driven discovery and complex multistep reasoning. In recent updates, ThoughtSpot modified core platform capabilities by expanding the Spotter AI agent to a suite of specialized AI agents (Spotter, SpotterModel, SpotterViz and SpotterCode), which added functionalities for complex query decomposition and cross-asset reasoning.
Zoho
Zoho provides Zoho Analytics as its analytics and business intelligence platform, which is available as a cloud service or deployed on-premises. Recent updates include the introduction of multimodel large language model flexibility, allowing administrators to configure specific models per use case, and new pipeline automation features within Zoho DataPrep. The platform includes Zia, an AI assistant that provides conversational analytics and automated insight generation.
The strongest Zoho Analytics capabilities are insight delivery, embedded analytics and conversational analytics. For insight delivery, the platform provides interactive visualizations alongside scheduled reporting and alert distribution. In embedded analytics, it supports extensive white-labeling, programmatic data filtering and multitenant security configurations. For conversational analytics, the Ask Zia assistant enables natural language interaction with data, supporting multistep queries, contextual follow-ups and continuous refinement through user feedback.
Its biggest opportunities for improvement across its capabilities are agentic insights and semantic modeling. For agentic insights, capabilities such as clustering and segmentation rely on explicit user configuration, including selecting model parameters like the number of clusters and normalization methods, rather than operating as fully proactive, fully autonomous background discovery. For semantic modeling, automated inference relies on traditional data type detection and basic relationship suggestions, rather than utilizing advanced knowledge graph technology.
Zoho Analytics’ strongest supported use case is composable analytics, indicating its suitability for organizations embedding analytics into internal applications or customer-facing portals. The platform provides SDKs and APIs to embed interactive dashboards. Its integration with Zoho Flow enables multistep write-back operations, allowing users to trigger external operational actions directly from analytics interfaces.
Context
This Critical Capabilities research evaluates products from 20 vendors also included in Magic Quadrant for Analytics and Business Intelligence Platforms on 8 capabilities in support of the four main use cases for ABI platforms. The ABI platform market is increasingly being disrupted by artificial intelligence, particularly with the rapid advancement of generative AI and AI agents (see Agentic Analytics Requires a Cohesive Architecture to Drive Value). This ongoing innovation often makes it challenging to consistently compare overall platform capabilities. Use this document to assess and compare vendors’ capabilities when selecting an ABI platform.
Market Definition
Analytics and business intelligence (ABI) platforms prepare, model, analyze and visualize data to support decision making. They deliver insights through AI-powered conversational experiences, interactive dashboards and classic reporting. They support collaboration between business and technical users for defining the dimensions, measures and business rules used to create and maintain semantic models. The platforms provide functionality for agentic analytics, where AI agents coordinate tasks across the data-to-insight workflow to automate insight delivery under governance and audit controls.
Analytics and business intelligence platforms integrate data from multiple sources, such as databases, spreadsheets, cloud services and external data feeds, to provide a unified view of data, breaking down silos and transforming raw data into meaningful insights. They also allow users to clean, transform and prepare data for analysis, in addition to creating data models that define relationships between different data entities.
Modern ABI increasingly embeds agentic analytics — AI agents that orchestrate tasks across the data‑to‑insight workflow (semiautonomously or autonomously) to accelerate insight delivery while keeping humans in the loop for oversight and strategy. This shift complements and, in part, displaces time spent in curated dashboards with automated, conversational and dynamically generated insights.
These platforms enable collaborative semantic models (consistent dimensions, measures and business rules), natural‑language query and automated insights that surface drivers, anomalies, clusters and forecasts with transparency and audit trails. Agent workflow orchestration coordinates data prep, analysis, visualization, narrative generation and action triggers under governance, lineage and policy‑as‑code controls, ensuring explainability and trust at scale.
Typical benefits of leveraging ABI platforms include:
- Insight velocity and cost‑to‑serve: AI agents automate repetitive data preparation and analysis, compressing cycle time from data to action and lowering operating costs compared with manual processes.
- Proactive, embedded experiences: Embedded, context‑aware analytics deliver narratives and recommendations inside business workflows, increasing adoption among nontechnical users.
- Governed autonomy and explainability: A robust semantic layer, lineage tracing, bias detection and human‑validation checkpoints build confidence in agent‑generated outputs and support compliance.
- Improved decision quality and confidence: These platforms provide timely, relevant and contextual insights that empower business users to make informed decisions, reducing reliance on intuition and increasing strategic alignment.
Mandatory Features
- Analytics governance: Refers to the set of capabilities that ensure secure, compliant and efficient management of analytics platforms. It includes controlling access, certifying content, managing life cycle policies, monitoring usage, optimizing performance, and enforcing auditability and policy-as-code to maintain trust and transparency across all analytics workflows.
- Data preparation: Supports drag-and-drop, user-driven combinations of data from different sources and the creation of analytic models, such as user-defined measures, data pipelines, sets, groups and hierarchies.
- Agentic insights: Agentic insights leverage AI agents to autonomously or semiautonomously surface insights such as anomalies, drivers, clusters and forecasts. These agents orchestrate tasks across the data-to-insight workflow, using active metadata and user feedback to deliver personalized, explainable insights under governance and audit controls.
- Conversational analytics: Enables users to interact with data through natural language — typed or spoken — and receive dynamically generated narratives and explanations. This capability supports intuitive querying and contextual storytelling, adapting responses to user roles, preferences and analytical complexity.
- Semantic modeling: An abstraction layer that supports both visual and code-based authoring of business logic, including entity-relationship modeling, hierarchies and calculated measures. It provides virtualization and headless access to govern data consistency across interactive dashboards, embedded analytics and agentic workflows. This capability unifies metrics with metadata context, enabling complex multifact joins, life cycle management, and the grounding required for GenAI and automated insights.
Optional Features
- Embedded analytics: These capabilities integrate analytical capabilities directly into business applications, websites and portals, enabling collaboration and communication of insights. They also support interactive and customizable reports and dashboards, offer robust API and SDK integration, allow data write-back to various sources and automate data-driven workflows to trigger business actions.
- Insight delivery: This capability provides a container for the content created by users or AI agents, such as dashboards, pixel-perfect and paginated reports that can be scheduled and shared with a large user community.
- Analytics catalog: Portal-like curation and collaboration of ABI content, enabling users to share, find, search, comment and certify dashboards, reports and datasets from a diverse range of platforms in one place.
Product/Service Trends
Analytics and business intelligence platforms enable advanced technical users and line-of-business users to model, analyze, explore, share and manage data, and to collaborate and share findings, enabled and augmented by AI. The platforms may optionally include the ability to create, modify or enrich a semantic model including business rules.
Critical Capabilities Definition
Agentic Insights
Leverage AI agents to autonomously or semiautonomously surface insights such as anomalies, drivers clusters and forecasts.
These agents orchestrate tasks across the data-to-insight workflow, using active metadata and user feedback to deliver personalized, explainable insights under governance and audit controls.
Analytics Catalog
Provides portal-like curation and collaboration of ABI content, enabling users to share, find, search, comment and certify dashboards, reports and datasets from a diverse range of platforms in one place.
Analytics Governance
Allows administrators to ensure secure, compliant and efficient management of analytics platforms.
It includes controlling access, certifying content, managing life cycle policies, monitoring usage, optimizing performance, and enforcing auditability and policy-as-code to maintain trust and transparency across all analytics workflows.
Conversational Analytics
Enables users to interact with data through natural language — typed or spoken — and receive dynamically generated narratives and explanations. It supports intuitive querying and contextual storytelling, adapting responses to user roles, preferences and analytical complexity.
Data Preparation
Supports drag-and-drop, user-driven combinations of data from different sources and the creation of analytics models, such as user-defined measures, data pipelines, sets, groups and hierarchies.
Embedded Analytics
Allows integration of analytical capabilities directly into business applications, websites and portals, enabling collaboration and communication of insights.
It also supports interactive and customizable reports and dashboards, offers robust API and SDK integration, allows data write-back to various sources, and automates data-driven workflows to trigger business actions.
Insight Delivery
Provides a container for the content created by users or AI agents, such as dashboards and pixel-perfect, paginated reports that can be scheduled and shared with a large user community.
Semantic Modeling
An abstraction layer that supports both visual and code-based authoring of business logic, including entity-relationship modeling, hierarchies and calculated measures.
It provides virtualization and headless access to govern data consistency across interactive dashboards, embedded analytics and agentic workflows. This capability unifies metrics with metadata context, enabling complex multifact joins, life cycle management, and the grounding required for GenAI and automated insights.
Use Cases
Perceptive Analytics
Leverages AI technologies, including AI agents, to deliver context-aware strategic insights and executable recommendations that continuously adapt to business conditions.
It does this by monitoring and responding to analysis of structured and unstructured data, business goals and user needs.
The highest-weighted capabilities in this use case are:
- Agentic insights
- Conversational analytics
- Semantic modeling
- Data preparation
- Embedded analytics
Composable Analytics
Combines multiple vendors to address different use cases and deliver insights integrated with user workflows, for organizations seeking a best-of-breed approach.
The highest-weighted capabilities in this use case are:
- Embedded analytics
- Semantic modeling
- Analytics catalog
- Analytics governance
- Conversational analytics
Data Storytelling
Combines interactive data visualization with narrative techniques to generate and deliver insights in compelling, easily assimilated forms.
The highest-weighted capabilities in this use case are:
- Conversational analytics
- Agentic insights
- Insight delivery
- Analytics catalog
Governance
Enables organizations to scale D&A initiatives in a governed way, managing content and platform utilization.
The highest-weighted capabilities in this use case are:
- Analytics governance
- Semantic modeling
- Analytics catalog
- Data preparation
Vendors Added and Dropped
We review and adjust our inclusion criteria for Critical Capabilities as markets change. As a result of these adjustments, the mix of vendors in any Critical Capability may change over time. A vendor’s appearance in a Critical Capability one year and not the next does not necessarily indicate that we have changed our opinion of that vendor. It may be a reflection of a change in the market and, therefore, changed inclusion criteria, or of a change of focus by that vendor.
Added
Databricks was added to this year’s Critical Capabilities report.
Dropped
Sisense was dropped from this year’s Critical Capabilities report.
Inclusion and Exclusion Criteria
This Critical Capabilities research used the same inclusion criteria as its companion Magic Quadrant for Analytics and Business Intelligence Platforms.
To qualify for inclusion in this research, vendors had to meet the following criteria:
- Offer a generally available software product that met Gartner’s definition of an ABI platform and offers at least five of the eight critical capabilities.
- Offer an ABI platform that is industry-agnostic, ensuring the solution is not confined to specific industry verticals.
- Demonstrate meaningful internal/stand-alone ABI adoption beyond embedded/OEM use, based on go-to-market focus, revenue contribution and production deployments.
Weighting for Critical Capabilities in Use Cases
| Critical Capabilities | Perceptive Analytics | Composable Analytics | Data Storytelling | Governance |
|---|---|---|---|---|
Agentic Insights | 30% | 0% | 25% | 0% |
Analytics Catalog | 0% | 10% | 10% | 25% |
Analytics Governance | 0% | 10% | 0% | 35% |
Conversational Analytics | 30% | 10% | 40% | 0% |
Data Preparation | 10% | 0% | 0% | 10% |
Embedded Analytics | 10% | 40% | 0% | 0% |
Insight Delivery | 0% | 0% | 25% | 0% |
Semantic Modeling | 20% | 30% | 0% | 30% |
As of 10 July 2026 | ||||
Source: Gartner (July 2026)
This methodology requires analysts to identify the critical capabilities for a class of products/services. Each capability is then weighted in terms of its relative importance for specific product/service use cases.
Critical Capabilities Rating
Each of the products/services that meet our inclusion criteria has been evaluated on the critical capabilities on a scale from 1.0 to 5.0.
Product/Service Rating on Critical Capabilities
| Critical Capabilities | Alibaba Cloud | Amazon Web Services | Databricks | Domo | GoodData.AI | IBM | Incorta | Microsoft | Oracle | Qlik | Salesforce (Tableau) | SAP | SAS | ServiceNow (Pyramid Analytics) | Sigma | Strategy | Tellius | ThoughtSpot | Zoho | |
|---|---|---|---|---|---|---|---|---|---|---|---|---|---|---|---|---|---|---|---|---|
Agentic Insights | 2.8 | 3.0 | 3.2 | 2.3 | 2.3 | 2.8 | 2.8 | 2.8 | 2.8 | 3.0 | 3.0 | 2.8 | 3.0 | 3.0 | 3.5 | 2.0 | 2.8 | 3.0 | 3.5 | 2.3 |
Analytics Catalog | 2.3 | 2.3 | 2.3 | 2.5 | 3.3 | 2.0 | 3.3 | 2.5 | 2.5 | 3.0 | 2.5 | 2.8 | 3.0 | 2.0 | 3.8 | 2.3 | 2.8 | 3.0 | 2.8 | 2.5 |
Analytics Governance | 3.0 | 2.3 | 3.5 | 3.0 | 3.0 | 3.8 | 2.3 | 4.0 | 3.0 | 2.5 | 2.5 | 3.5 | 3.0 | 2.3 | 3.8 | 3.0 | 3.5 | 2.8 | 3.8 | 2.8 |
Conversational Analytics | 3.3 | 3.6 | 3.1 | 3.2 | 3.4 | 3.3 | 3.2 | 2.8 | 1.8 | 2.8 | 2.5 | 3.0 | 3.0 | 2.2 | 4.0 | 3.3 | 3.0 | 3.8 | 3.9 | 2.9 |
Data Preparation | 3.3 | 2.8 | 3.5 | 3.8 | 3.0 | 2.0 | 2.5 | 3.3 | 3.0 | 4.5 | 3.3 | 4.3 | 2.0 | 3.0 | 4.5 | 2.8 | 2.8 | 3.0 | 3.5 | 2.8 |
Embedded Analytics | 2.7 | 2.5 | 3.0 | 3.8 | 3.5 | 2.2 | 1.8 | 3.0 | 2.8 | 2.3 | 2.8 | 3.2 | 2.0 | 2.7 | 4.0 | 3.3 | 2.8 | 3.0 | 3.7 | 3.2 |
Insight Delivery | 3.2 | 3.4 | 3.2 | 3.4 | 3.5 | 3.3 | 3.0 | 2.9 | 3.3 | 3.4 | 3.5 | 3.5 | 3.2 | 3.4 | 3.6 | 3.1 | 3.7 | 3.2 | 3.1 | 3.4 |
Semantic Modeling | 3.0 | 3.4 | 3.5 | 1.8 | 3.5 | 2.9 | 1.9 | 2.9 | 3.4 | 2.4 | 2.8 | 3.4 | 1.6 | 1.9 | 3.4 | 2.8 | 3.6 | 3.9 | 3.4 | 2.6 |
As of 10 July 2026 | ||||||||||||||||||||
Source: Gartner (July 2026)
Table 3 shows the product/service scores for each use case. The scores, which are generated by multiplying the use-case weightings by the product/service ratings, summarize how well the critical capabilities are met for each use case.
Product Score in Use Cases
| Use Cases | Alibaba Cloud | Amazon Web Services | Databricks | Domo | GoodData.AI | IBM | Incorta | Microsoft | Oracle | Qlik | Salesforce (Tableau) | SAP | SAS | ServiceNow (Pyramid Analytics) | Sigma | Strategy | Tellius | ThoughtSpot | Zoho | |
|---|---|---|---|---|---|---|---|---|---|---|---|---|---|---|---|---|---|---|---|---|
Perceptive Analytics | 3.03 | 3.19 | 3.24 | 2.77 | 3.06 | 2.83 | 2.61 | 2.89 | 2.64 | 2.90 | 2.82 | 3.17 | 2.52 | 2.51 | 3.78 | 2.76 | 3.02 | 3.42 | 3.62 | 2.68 |
Composable Analytics | 2.84 | 2.84 | 3.14 | 2.93 | 3.42 | 2.66 | 2.17 | 3.00 | 2.87 | 2.47 | 2.71 | 3.23 | 2.18 | 2.30 | 3.78 | 3.02 | 3.13 | 3.33 | 3.55 | 2.88 |
Data Storytelling | 3.05 | 3.27 | 3.07 | 2.96 | 3.14 | 3.05 | 3.06 | 2.80 | 2.50 | 3.02 | 2.88 | 3.06 | 3.05 | 2.68 | 3.76 | 2.83 | 3.11 | 3.37 | 3.49 | 2.84 |
Governance | 2.86 | 2.68 | 3.20 | 2.60 | 3.23 | 2.90 | 2.45 | 3.23 | 3.00 | 2.80 | 2.67 | 3.38 | 2.48 | 2.18 | 3.75 | 2.75 | 3.29 | 3.20 | 3.40 | 2.67 |
As of 10 July 2026 | ||||||||||||||||||||
Source: Gartner (July 2026)
To determine an overall score for each product/service in the use cases, multiply the ratings in Table 2 by the weightings shown in Table 1.
Critical Capabilities Methodology
This methodology requires analysts to identify the critical capabilities for a class of products or services. Each capability is then weighted in terms of its relative importance for specific product or service use cases. Next, products/services are rated in terms of how well they achieve each of the critical capabilities. A score that summarizes how well they meet the critical capabilities for each use case is then calculated for each product/service.
"Critical capabilities" are attributes that differentiate products/services in a class in terms of their quality and performance. Gartner recommends that users consider the set of critical capabilities as some of the most important criteria for acquisition decisions.
In defining the product/service category for evaluation, the analyst first identifies the leading uses for the products/services in this market. What needs are end-users looking to fulfill, when considering products/services in this market? Use cases should match common client deployment scenarios. These distinct client scenarios define the Use Cases.
The analyst then identifies the critical capabilities. These capabilities are generalized groups of features commonly required by this class of products/services. Each capability is assigned a level of importance in fulfilling that particular need; some sets of features are more important than others, depending on the use case being evaluated.
Each vendor’s product or service is evaluated in terms of how well it delivers each capability, on a five-point scale. These ratings are displayed side-by-side for all vendors, allowing easy comparisons between the different sets of features.
Ratings and summary scores range from 1.0 to 5.0:
1 = Poor or Absent: most or all defined requirements for a capability are not achieved
2 = Fair: some requirements are not achieved
3 = Good: meets requirements
4 = Excellent: meets or exceeds some requirements
5 = Outstanding: significantly exceeds requirements
To determine an overall score for each product in the use cases, the product ratings are multiplied by the weightings to come up with the product score in use cases.
The critical capabilities Gartner has selected do not represent all capabilities for any product; therefore, may not represent those most important for a specific use situation or business objective. Clients should use a critical capabilities analysis as one of several sources of input about a product before making a product/service decision.