Magic Quadrant for Observability Platforms
13 July 2026 - ID G00840178 - 49 min read
By Padraig Byrne, Martin Caren, and 2 more
Observability platforms are reshaping the way organizations oversee system health, propelled by advancements in analytics and cost management, and the rise of AI-driven observability. I&O leaders can use this research to assess and navigate the shifting vendor and solution landscape.
Market Definition/Description
This document was revised on 23 July 2026. The document you are viewing is the corrected version. For more information, see the Corrections page on gartner.com.
Gartner defines observability platforms as products that help organizations understand and optimize the health, performance and behavior of applications, services, infrastructure and AI agents, as well as user experience. They ingest and analyze telemetry such as logs, metrics, events and traces to detect issues that affect end users, enabling early remediation. These platforms are used by IT operations, SRE, platform engineering, developers, security teams and product owners.
Modern businesses rely on critical digital applications and services that directly influence revenue, client satisfaction and brand reputation. Outages, latency and degraded performance harm these outcomes. Observability platforms address this by ingesting, correlating and analyzing telemetry from applications, infrastructure and AI systems to detect anomalies, identify the root cause of issues and quantify user‑experience impact.
These capabilities enable organizations to improve the availability, performance and resilience of digital services. As a result, observability platforms support revenue‑loss avoidance through early detection, faster mean time to resolution and prevention of customer‑impacting failures. They also accelerate development and platform engineering workflows by providing continuous feedback on code changes, deployments and model behavior. This allows teams to deliver new features and AI capabilities faster while maintaining reliability and improving customer experience.
Mandatory Features
At a minimum, observability platforms must:
- Ingest, store and analyze operational telemetry feeds, including, but not limited to, metrics, event, log and trace data, with native support for OpenTelemetry.
- Identify, predict and analyze changes in application, service and infrastructure behavior to determine the causes of outages or performance degradation and quantify their impact on end-user experience.
- Enrich telemetry with contextual information, such as topological dependencies or service mapping.
- Support the modeling or mapping of relationships between monitored services and their role in business transactions.
- Collect telemetry from public cloud providers, such as Amazon Web Services and Microsoft Azure.
- Support interactive exploration and analysis of multiple telemetry types, including traces, metrics and logs, to generate insights into user and application behavior.
- Provide automated discovery and mapping of related infrastructure, network, and application components and services.
Optional Features
- Digital experience monitoring (DEM) capabilities, including real user monitoring (RUM) and synthetic monitoring, to analyze the performance, availability and user experience of applications and services delivered through browsers, mobile apps and APIs.
- Integration with operations, service management and software development technologies, such as IT service management (ITSM), configuration management databases (CMDBs), event and incident response management, orchestration and automation, and DevOps tools.
- Telemetry management capabilities for filtering, routing, sampling and aggregating data pipelines to optimize storage costs and improve signal quality. These capabilities also support data privacy and compliance through automated detection, masking or redaction of personally identifiable information (PII) and other sensitive data.
- Advanced analytics and machine learning provide insights that are not feasible through manual analysis.
- Cost management features that measure and optimize application workload cost, as well as observability platform utilization or spend.
- Business process and activity monitoring reflects user journeys, such as login to check out, funnel analysis to track conversion rates, customer onboarding or loan applications.
- AI observability capabilities to analyze the performance, cost and compliance of large language models and generative AI workloads using metrics, such as hallucination detection, token utilization, response relevance and per-token latency.
- Automation capabilities that initiate changes to application and infrastructure code or configuration to optimize cost, capacity or performance, or remediate failures or degradation.
- Application security capabilities that ingest security telemetry, identify known vulnerabilities in monitored applications and block attempts to exploit them.
- Support for monitoring agentic AI architectures by tracing autonomous workflows and tool interactions, ensuring transparency across components using open standards, such as the Model Context Protocol (MCP).
Magic Quadrant
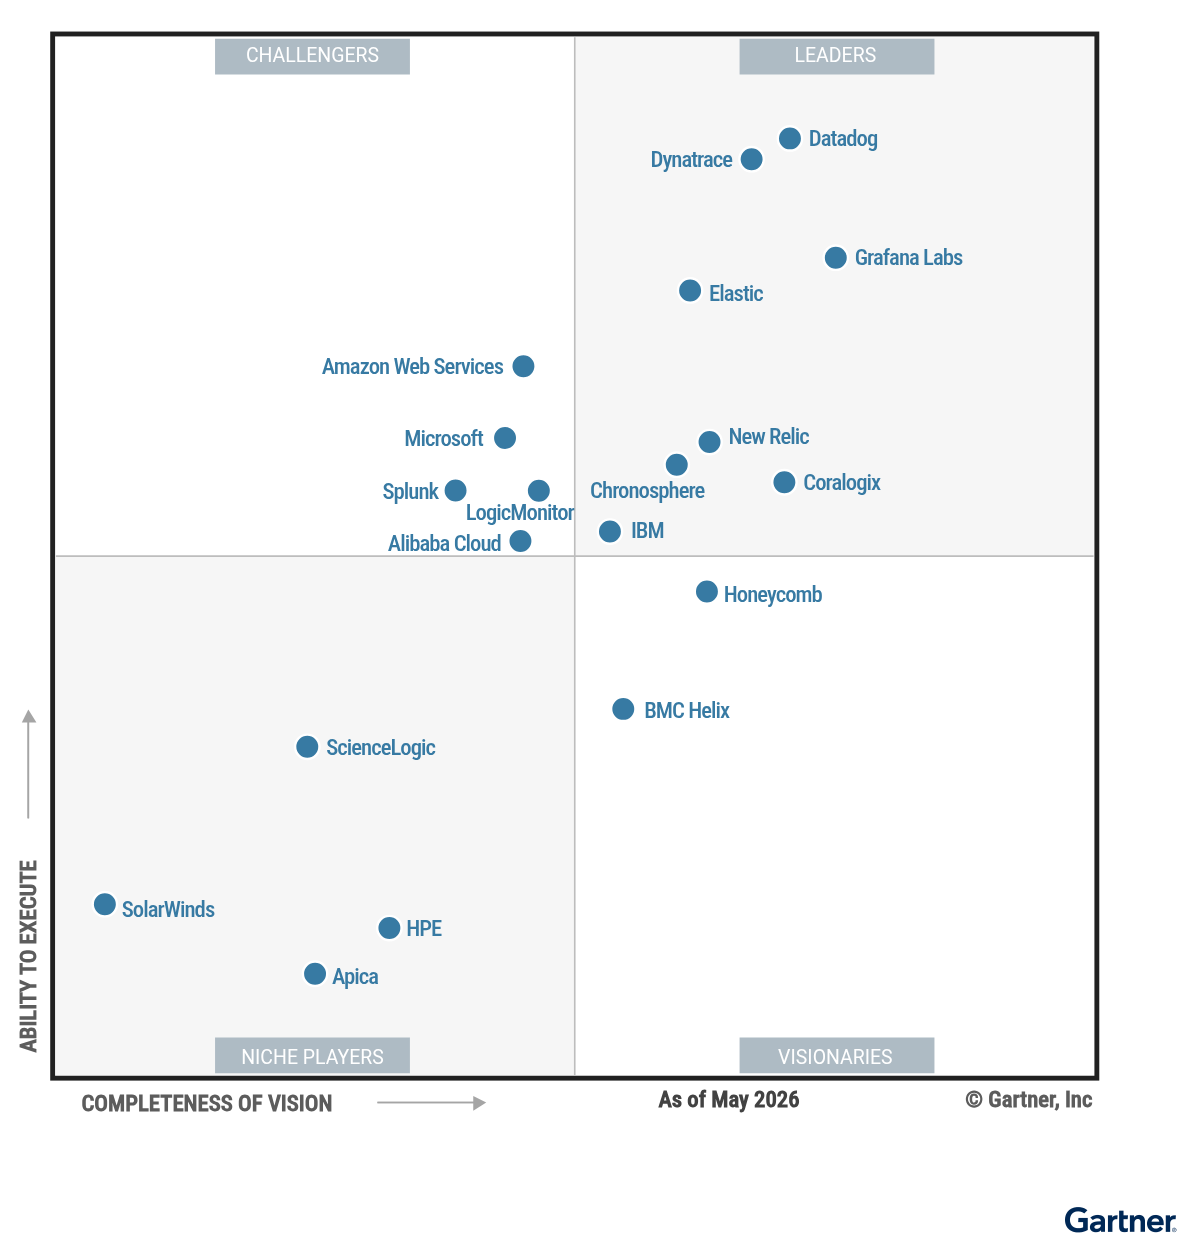
Vendor Strengths and Cautions
Alibaba Cloud
Alibaba Cloud is a Challenger in this Magic Quadrant. Its observability offering, rebranded in September 2025 as Cloud Monitor 2.0, provides a unified “one-stop” platform by integrating previously siloed services — including Cloud Monitor, Simple Log Service (SLS), and Application Real-Time Monitoring Service (ARMS) — into a single view. Alibaba Cloud predominantly serves the Asia/Pacific (APAC) region, including Singapore, Japan and Indonesia, with an increasing presence in EMEA and Mexico. Its roadmap focuses on evolving UModel into a comprehensive IT Digital Twin and transitioning toward an agentic AI-driven ecosystem to automate complex troubleshooting workflows.
- Product features: Cloud Monitor 2.0 unifies previously siloed telemetry streams into a single platform powered by the UModel knowledge graph. This reduces tool sprawl and enables better cross-domain analysis for existing Alibaba Cloud customers.
- Market responsiveness: Alibaba Cloud recently released LLM Observability & Evaluation, which allows organizations to monitor the performance and safety of their own AI models directly within the observability framework.
- Sales strategy: Alibaba Cloud leverages an “AnyStack” strategy, allowing customers to deploy observability services in their own data centers. This may be effective for organizations with strict digital sovereignty requirements or those operating in hybrid cloud environments.
- Geographic strategy: Despite expansion efforts in EMEA and Latin America, Alibaba Cloud’s market presence and support infrastructure remain heavily concentrated in Greater China and Southeast Asia. Organizations outside these regions may find limited local expertise and a smaller partner ecosystem compared to global competitors.
- Market execution: Alibaba Cloud’s observability adoption is primarily tied to its own cloud infrastructure, limiting its appeal for cloud-neutral or non-Alibaba multicloud strategies. While OpenTelemetry (OTel) support exists, the most advanced features often require deep dependency on Alibaba Cloud’s proprietary services.
- Sales execution/pricing: The consumption-based pricing model for high-volume log-and-trace ingestion can become unpredictable for large-scale enterprise deployments. Some clients report complexity in estimating costs when utilizing advanced AI-driven features and vector search capabilities within SLS.
Amazon Web Services
Amazon Web Services (AWS) is a Challenger in this Magic Quadrant. AWS observability includes Amazon CloudWatch, a platform for monitoring metrics, traces, logs, events and other telemetry data; AWS DevOps Agent; Amazon OpenSearch Service for search and analytics; Amazon Managed Service for Prometheus and Amazon Managed Grafana, which are positioned for container-native teams who already use the Prometheus/Grafana ecosystem. AWS serves a global customer base, ranging from small businesses to large enterprises.
- AI features: The AWS DevOps Agent represents a shift toward agentic observability. It autonomously investigates production incidents by indexing code repositories, integrating with CI/CD pipelines, correlating telemetry, code commits and deployment timelines. This approach helps reduce mean time to resolution (MTTR).
- Market responsiveness: AWS has expanded its generative AI (GenAI) observability capabilities to support the explosion of AI-native workloads. New features such as dedicated GenAI monitoring for Bedrock and open frameworks allow teams to track token costs, model latency and chain-of-thought execution, addressing a critical visibility gap for AI engineering teams.
- Product: CloudWatch operates as a fully managed service with elastic scaling, retry mechanisms and cross-region observability capabilities. This integrated architecture reduces the operational burden associated with managing observability at enterprise scale.
- Ecosystem limitations: While the AWS DevOps Agent supports Azure and on-premises workloads and CloudWatch supports data from external sources, AWS observability is primarily designed for its own ecosystem. Clients with significant footprints in other hyperscale ecosystems may find that third-party platforms offer a more consistent experience.
- Portfolio strategy: Comprehensive observability may require balancing a mix of distinct AWS monitoring capabilities across different platform layers. This structural friction may limit operational cohesion, requiring teams to manually bridge disconnected data workflows.
- Pricing model: The cumulative cost of AWS observability telemetry can become challenging to predict. The primary barrier is navigating interlocking, multifaceted billing metrics across separate capabilities, which complicates spend forecasting within large, dynamic environments.
Apica
Apica is a Niche Player in this Magic Quadrant. Its observability platform, Apica Ascent, features a robust data management suite with integrated observability pipeline functionality. The company’s primary operations are in the U.S. and EMEA, with most customers based in North America. Established in 2005, Apica initially built its reputation on synthetic monitoring, notably supporting multifactor authentication within synthetic workflows. Planned enhancements include embedding GenAI “co-pilots” and agentic AI for autonomous triage and remediation across its unified data and observability platform.
- Product strategy: Apica’s pipeline-first architecture allows enterprises to process, filter and mask telemetry before it reaches expensive downstream platforms. This focus on the first mile of data addresses the critical market pain point of escalating ingest costs.
- Innovation: The patented InstaStore technology enables high-volume data storage on low-cost AWS S3-compatible object storage without requiring data rehydration. This innovation provides a highly scalable and cost-effective alternative to traditional compute-intensive observability databases.
- Market understanding: Apica has pivoted to support agentic AI workloads by introducing synthetic monitoring for AI agents and large language model (LLM)-specific observability pipelines. These features provide early-market capabilities for monitoring the performance and reliability of autonomous AI systems.
- Product: The platform’s reliance on highly customizable pipeline rules, scripting and routing logic can increase operational complexity. Misconfigured filtering, sampling or transformation rules can reduce data scope if applied too broadly, but Apica’s platform never drops or alters data on its own. Full data fidelity is always preserved when pipelines are correctly configured.
- Geographic strategy: Apica’s sales and support presence is significantly smaller than that of major competitors, with limited coverage in the Asia/Pacific and Japan (APJ) and Latin America (LATAM) regions. International enterprises may experience slower response times or limited local language support outside of their core markets.
- Marketing execution: The complexity of Apica’s “Telemetry Data Fabric” messaging can be difficult for nontechnical buyers to grasp compared to simpler all-in-one platform pitches. Apica must simplify its value proposition to compete more effectively for mainstream IT operations budgets.
BMC Helix
BMC Helix is a Visionary in this Magic Quadrant. Its Observability & AIOps suite offers a variety of IT operations and monitoring solutions, incorporating products such as BMC Helix Discovery. BMC Helix also holds a notable position in the IT service management space through its BMC Helix ITSM (previously Remedy) solution. The company operates on a global scale, serving organizations across diverse industries and sizes. Future enhancements include advancing Helix into agentic ServiceOps to deliver CFO-visible cost governance and AI-native event intelligence.
- Product strategy: Helix Observability is tightly integrated with BMC Helix’s broader IT service management, automation and operations tooling, making it an option for those clients looking to move toward integrated service operations tooling.
- Innovation: The introduction of specialized AI agents, such as the RCA Agent and Post- Mortem Analyzer, demonstrates an application of GenAI to the operations life cycle. These agents provide actionable, human-readable remediation plans and vulnerability resolution.
- Sales strategy: Leveraging its long history with enterprise clients, BMC Helix has developed deep vertical expertise in a number of industry sectors. Its platform includes prebuilt compliance and reporting templates that cater specifically to these industries’ governance needs.
- Ownership structure: Montagu, a private equity firm, announced in June 2026 that it will acquire a majority stake in the company. Enterprise clients may wish to engage with their BMC Helix account teams to stay apprised of developments during the transition period.
- Marketing execution: Despite the rebranding to BMC Helix, the company continues to face perception challenges as a more “traditional” vendor when compared to cloud-native competitors. The company must continue demonstrating both its modern capabilities and that its underlying architecture is as performant as those of newer competitors.
- Pricing: The complexity of BMC Helix’s licensing can make it difficult for prospective buyers to easily assess products and accurately predict costs compared to leaders in the market.
Chronosphere
Chronosphere is a Leader in this Magic Quadrant. Palo Alto Networks completed the acquisition of Chronosphere in January 2026 and intends to maintain Chronosphere as a separate dedicated observability solution with its own roadmap. Chronosphere’s observability solution is the Chronosphere Observability Platform, and includes its observability pipeline product and cost optimization feature set. The company primarily operates in the U.S. and EMEA, with most clients located in North America. Future enhancements include expanding Palo Alto Networks AgentiX for autonomous remediation and integrating native digital experience monitoring (DEM) into its core troubleshooting workflows.
- Product features: The platform’s ability to handle very high-volume, high-velocity metrics while maintaining control of costs provides Chronosphere with a clear differentiator. This allows enterprises to scale modern microservices architectures while reducing exponential cost overruns.
- Viability: The acquisition by Palo Alto Networks has significantly bolstered Chronosphere’s credibility and financial backing. Clients, especially those with existing Palo Alto agreements, who may have disregarded Chronosphere in the past due to its small market presence, should reevaluate.
- Innovation: Chronosphere’s recent agentic AI enhancements include a number of subagents that work together to provide quicker identification of problems and speed time to problem identification while retaining human-in-the-loop control.
- Operations: The recent acquisition by Palo Alto Networks introduces potential integration risks and organizational flux. Customers should monitor whether the support model that Chronosphere was known for is maintained as it scales into a much larger corporate structure.
- Traditional APM: Organizations with very deep legacy Java or .NET application performance monitoring (APM) requirements might find the platform less suitable than traditional APM providers.
- Geographic strategy: To date, Chronosphere has been heavily concentrated in North America, with only a small portion of clients (and sales and support) for other geographies. This has limited suitability for clients looking for an observability solution for their international locations.
Coralogix
Coralogix is a Leader in this Magic Quadrant. Its platform addresses both observability and security needs, leveraging its data pipeline framework, Streama. The company operates primarily in the U.S. and EMEA, with its customer base concentrated in North America and EMEA. Recent additions include Host Observability for Fleet Management and AI Observability enhancements. Future roadmap items include advancing its real-time operational data platform with deeper “Olly” AI autonomy for schemaless investigation and remediation.
- Telemetry analysis: The Streama architecture allows for real-time analysis and alerting on telemetry in-stream, enabling customers to store data in lower-cost archives while maintaining high-priority visibility.
- Innovation: The introduction of Olly, an autonomous AI agent, combined with the MCP Server for AI connectivity, places Coralogix at the forefront of the shift toward agentic, self-healing observability. Integration with Slack and GitHub enables tight operational and developer workflows while maintaining a human-in-the-loop presence where desired.
- Sales strategy: Coralogix’s Total Cost of Ownership (TCO) Optimizer enables granular cost management across telemetry types. Users can assign priority levels (high, medium, low) or block data for logs and traces, while providing dedicated controls to block or reduce metric volumes.
- Market awareness: Limited global brand awareness often hinders Coralogix’s inclusion in large-scale enterprise consolidations. Despite expanded capabilities, a persistent “log-first” perception creates competitive headwinds against vendors with broader observability roots.
- Geographic strategy: Coralogix’s direct sales and support reach in the APAC and LATAM regions is still maturing compared to other Leaders in this Magic Quadrant.
- Operational management: While Coralogix manages data ingestion and processing, customers remain responsible for the underlying S3 infrastructure. Organizations will need to monitor S3 usage and associated costs, which can introduce administrative load.
Datadog
Datadog is a Leader in this Magic Quadrant. Its observability solution is integrated within a comprehensive suite that also addresses several different monitoring and security requirements. In January 2026, Datadog announced the acquisition of Propolis, an autonomous quality assurance testing platform. Recent additions to the Datadog portfolio include Bits AI site reliability engineering (SRE) for incident investigations, Data Observability and developer tools. Planned enhancements include expanding Bits AI into a unified agent for autonomous operations, and delivering specialized observability for AI-native workloads.
- Portfolio breadth: Datadog continues to lead the market in platform consolidation, with more than 20 integrated products that allow customers to replace multiple point solutions in a single interface.
- Market responsiveness: The general availability of Bits AI SRE demonstrates a mature application of GenAI, providing automated incident investigations and code-level insights that significantly reduce outages and improve reliability.
- Marketing execution: Datadog demonstrates strong presence and leadership through a comprehensive marketing strategy that includes hosting its own events (DASH) and significant participation in industry events like AWS re:Invent.
- Pricing: Datadog has improved cost predictability through additional governance controls, flexible retention tiers such as Flex Logs and alternative pricing constructs. However, its highly granular pricing across ingestion, indexing, hosts and containers still requires diligent operational oversight, creating cost management challenges for large enterprises.
- Geographic strategy: Datadog has expanded data residency through BYOC Log Management and Observability Pipelines, enabling localized control and in-country log retention. Even so, as a primarily SaaS-based platform, full stack observability still requires some telemetry, such as metrics and traces, to be processed in Datadog regions. This limits use for strict sovereignty or air-gapped requirements.
- Vendor lock-in: While Datadog supports OTel, its value proposition is still heavily tied to its proprietary agent, which can lead to concerns regarding long-term vendor lock-in for some organizations.
Dynatrace
Dynatrace is a Leader in this Magic Quadrant. Its unified platform spans Infrastructure and Application Observability, AI Observability and Governance, and Dynatrace Intelligence, an agentic framework for autonomous operations, grounded in deterministic AI. Dynatrace serves clients worldwide, including LATAM and APJ, with a customer base largely composed of major enterprises and tech-focused organizations. Planned enhancements include shifting toward fully autonomous ops with a collaborative agentic ecosystem and expanded observability for AI workloads.
In April 2026, Dynatrace announced the acquisition of Bindplane, an observability pipeline product company.
- Innovation: Dynatrace Intelligence provides an AI layer that allows users to define objectives, which the system executes within established policy guardrails. This approach facilitates a shift toward automated observability by aligning AI actions with specific organizational requirements and safety constraints.
- Product: Dynatrace’s Smartscape topology and Dynatrace Intelligence AI engine represent a gold standard for real-time, high-fidelity dependency mapping. This deterministic AI framework automates root-cause isolation, allowing enterprise clients to significantly accelerate incident resolution and reduce manual troubleshooting overhead with built-in and third-party agents.
- Compliance: The vendor’s focus on compliance (DORA, GDPR) and sovereign cloud options makes it a dominant player in European and North American regulated industries like banking and government.
- Messaging: The platform’s messaging, ranging from “causal AI” to “fusion of deterministic and agentic AI,” can be confusing for buyers who are bombarded with competing AI claims from nearly every vendor in the space.
- Onboarding experience: Maximizing the capabilities of the Dynatrace platform comes with a relatively steep learning curve, which may require a dedicated team of “power users” within the organization.
- Shareholder activity: Dynatrace is currently navigating strategic discussions with an activist investor. The company remains profitable and stable; however, as part of a standard vendor risk assessment, procurement leaders should continue to monitor the situation.
Elastic
Elastic is a Leader in this Magic Quadrant. Its portfolio spans several deployment options, including self-hosted, cloud-hosted and a fully managed SaaS solution with a stateless architecture. Elastic Observability leverages the Search AI Platform, which also supports the company’s search and security offerings. Elastic Cloud, a managed service, is accessible via major cloud providers, while the Serverless model offers a usage-based, fully managed experience within Elastic Cloud. Based in North America, Elastic’s client base is concentrated in the Americas and EMEA. Recent releases include AI and LLM observability and Amazon Bedrock AgentCore integration. Roadmap items include AI-driven observability through automated investigations and “Significant Events” detection.
- Business model: Elastic’s ability to serve as a unified platform for search, security and observability provides a unique and compelling TCO story for organizations already invested in the Elastic ecosystem.
- Market responsiveness: The 2026 launch of agentic observability with the Agent Builder and its open-sourcing of Agent Skills positions Elastic as a leader in the collaborative AI ecosystem.
- OTel integration: Elastic supports all telemetry signals with native OTel integration, offering options like upstream software development kits, community collectors, and Elastic Distributions of OpenTelemetry (EDOT) for enterprise support and reliable deployment.
- Marketing execution: Elastic is often still viewed primarily as a search engine, and it continues to face challenges in being recognized as a premier observability platform.
- Product strategy: Despite the power of Elasticsearch Query Language (ES|QL), without significant custom configuration, Elastic lacks some of the deep, automated topology mapping and autoremediation features found in the native Leader platforms.
- Cost scaling: For self-managed Elasticsearch deployments, managing high-volume indexes can scale quickly, requiring disciplined use of data tiering and life cycle management policies to control costs. Managed and serverless offerings include usage-based pricing and automated life cycle management, reducing operational overhead, but cost governance remains important at scale.
Grafana Labs
Grafana Labs is a Leader in this Magic Quadrant. Originating from the widely adopted open-source Grafana project, the company has expanded its portfolio to include additional open-source initiatives such as Loki, Tempo, Mimir, Beyla and Faro, and employs many core contributors to Prometheus and OTel. Grafana Cloud serves as its primary observability platform, with a customer base that is global but primarily concentrated in North America and EMEA. Recent enhancements include a new context-aware AI agent for querying and dashboarding, and cost management for traces. Upcoming plans include transforming Grafana Cloud into an agentic-first platform featuring autonomous AI SRE workflows and a unified Digital Experience Monitoring suite.
- Sales strategy: Grafana’s open-source heritage, strong association with Kubernetes environments and product-led-growth sales provide a frictionless entry point, allowing it to expand its offering from a single developer dashboard into a full enterprisewide observability platform.
- Innovation: Grafana’s Knowledge Graph and Instrumentation Hub inject native architectural context and correlation into the open-source telemetry stack. This eliminates manual dashboard mapping, allowing faster root-cause analysis capabilities without expanding administrative overhead.
- Market responsiveness: The Adaptive Metrics and Adaptive Traces features address the market’s primary pain point by automatically identifying and reducing low-value telemetry as a way to lower costs.
- Customer experience: Setting up and maintaining a do-it-yourself observability stack based on Grafana components requires specialized expertise in Prometheus and OTel, which can be a hurdle for less mature IT organizations.
- Offering (product) strategy: The reliance on multiple separate back-end databases (e.g., Mimir for metrics, Loki for logs) can create more architectural complexity than the unified data models used by other vendors.
- Security risk: A mid-2026 upstream supply chain exploit compromised Grafana Labs’ repository pipeline via a privileged token. While swiftly remediated with zero production environment impact, it highlights the inherent supply chain risks associated with external third-party open-source dependencies used within CI/CD workflows.
Honeycomb
Honeycomb is a Visionary in this Magic Quadrant. Its observability platform is designed for high-cardinality telemetry and prioritizes open standards, catering to engineering teams seeking real-time, exploratory insights. Most of its customers are in North America and EMEA, with recent expansions in APAC and LATAM. Recent enhancements include Honeycomb Metrics and Observability for AI-powered software development. Upcoming releases will include introducing Agent Timeline and its Canvas Agent to support autonomous investigation of long-running agentic workflows and AI systems. The platform uses a unified columnar datastore and is built on OTel, enabling analysis of raw event data without preaggregation and supporting investigation of complex, high-dimensional datasets.
- Product: The launch of Honeycomb Metrics successfully bridges the gap between traditional time-series monitoring and event-based observability on a single platform, reducing the need for separate tooling.
- Innovation: Honeycomb’s Canvas AI guides investigative reasoning by assembling evidence and context to speed up root-cause analysis, while keeping engineers in control.
- Offering (product) strategy: The Refinery 3.0 tail-sampling proxy and S3 rehydration capabilities provide enterprises with sophisticated tools to manage massive telemetry volumes cost-effectively.
- Sales execution: Perception remains that Honeycomb is a tool for specialized SRE teams, which can make it a harder sell for traditional IT operations groups.
- Geographic strategy: Despite growth in EMEA and APAC, Honeycomb’s sales and support teams for the LATAM region remain largely U.S.-based, which may limit local enterprise engagement, particularly in-region.
- Customer experience: Honeycomb’s approach to observability differs meaningfully from traditional tools, requiring teams to invest in onboarding and adjust existing workflows before realizing full value. Organizations should plan for an adoption period and ensure adequate internal support to drive successful rollout.
HPE
(Hewlett Packard Enterprise (HPE) is a Niche Player in this Magic Quadrant. Its observability offering, HPE OpsRamp Software, is delivered as a service through the HPE GreenLake platform, providing a service-centric view of hybrid and multicloud environments. The platform supports broad telemetry ingestion through more than 3,000 native integrations and full compatibility with OTel and Prometheus standards. Recent updates have introduced centralized log aggregation, OTel trace compression, policy-as-code observability and GenAI-driven incident summaries. Looking forward, HPE’s roadmap highlights the development of Extended Berkeley packet filter (eBPF)-based auto-instrumentation and the implementation of autonomous remediation loops to drive its agentic AI-driven operations strategy.
- Product strategy: Integration with the HPE GreenLake platform provides a differentiated hybrid cloud governance and visibility story for existing HPE infrastructure customers.
- Sales strategy: A strong global partner ecosystem of global system integrators and managed service providers (MSPs) allows HPE to deliver localized, managed observability services at scale.
- Industry strategy: Strong alignment with government and sovereign-cloud requirements makes OpsRamp an option for highly regulated sectors in Europe and the Middle East.
- Portfolio sales: OpsRamp’s integration with HPE GreenLake often leads buyers to perceive it as a secondary add-on rather than a stand-alone observability solution. Application teams will struggle to justify its adoption in environments that lack a significant HPE footprint.
- Product: An infrastructure-first perception prevents the vendor from effectively serving as a single source of truth for modern containerized environments. Clients may need to maintain high-cost APM tools to satisfy the requirements of their software engineering teams.
- Integration: The complexity of integrating other various HPE products (e.g., Morpheus, Juniper) can create a steep learning curve for teams not already standardized on the HPE stack.
IBM
IBM is a Leader in this Magic Quadrant. Its observability solution, IBM Instana Observability, is built on a telemetry engine that provides automated broad visibility with one-second granularity and real-time dependency mapping. Recent releases have introduced an agentic-AI Intelligent Investigation feature for accelerated root cause analysis, as well as dedicated GenAI and LLM observability for monitoring prompt tracing and token costs. IBM is currently executing a roadmap to unify its IT operations portfolio into the IBM Concert platform, with ongoing development focused on aligning core capabilities and new cross-domain agentic intelligence together for coordinated, governed actions.
- Market strategy: IBM’s extensive enterprise installed base provides a substantial built-in addressable market, with existing customer relationships accelerating platform adoption across accounts already standardized on IBM infrastructure and services.
- Product features: Instana uses deterministic and statistical models to identify issues, applying GenAI only for explanation and guidance. This transparent approach builds trust and distinguishes Instana from platforms that use GenAI directly on raw telemetry.
- Innovation: The integration of Kubecost for unified performance and cost analysis provides a differentiated FinOps-aware observability view that resonates with cloud-native enterprises struggling to control costs.
- Portfolio integration: IBM is working toward a more unified experience through its Concert platform. However, Instana, Turbonomic and SevOne remain distinct products that require separate installation and administration in practice. This fragmentation can limit the efficiency gains expected from single-vendor consolidation.
- Marketing execution: Instana faces the risk of brand dilution within the vast IBM software portfolio, slowing its perception as a “best-of-breed” agile innovator.
- Sales strategy: Licensing is often complex when combined with broader IBM Enterprise Agreements, often leading to protracted procurement cycles for new customers.
LogicMonitor
LogicMonitor is a Challenger in this Magic Quadrant. Its LM Envision platform provides hybrid observability across cloud, on-premises, SaaS, containerized environments and AI infrastructure using a collector-based architecture; and with Edwin AI, it supports agentic AIOps. Its customers are primarily in North America and EMEA, with a smaller presence in APAC. Recent enhancements include expanded cloud and network monitoring, an OTel collector, redesigned event intelligence, improved AI-driven investigations and broader integrations following the Catchpoint acquisition. The roadmap emphasizes deeper OTel-native ingestion, expanded Edwin AI agents and tighter integration of digital experience insights with core observability.
- Market responsiveness: The December 2025 acquisition of Catchpoint has significantly bolstered LogicMonitor’s digital experience monitoring (DEM) and internet performance monitoring (IPM) capabilities, filling a key product gap in its portfolio.
- Innovation: The Edwin AI agents for metrics and logs move the platform toward autonomous operations by providing automated remediation and Ansible playbook integration.
- Overall viability: LogicMonitor exhibits strong stability with sustained profitability and a consistent growth trajectory. For enterprise clients, this reduces long-term vendor risk and ensures a reliable roadmap for continuous platform innovation.
- Acquisition challenges: The rebranding and integration of Catchpoint may cause temporary market confusion regarding LogicMonitor’s identity as it pivots from infrastructure to include DEM.
- Limited native SLOs: LogicMonitor’s service-level objective (SLO) and error budget management capabilities rely on partners like Nobl9. While it supports service modeling and availability tracking, formal SLO math (error budgets, burn-rate alerting) is external. Organizations needing tightly integrated SLO analytics must factor in extra tooling, integration and licensing costs.
- Deployment model: LogicMonitor’s agentless approach requires distributed collectors across segments and clusters, which can increase fleet management overhead and operational complexity at scale, offsetting some of the expected operational savings versus agent-based approaches.
Microsoft
Microsoft is a Challenger in this Magic Quadrant. Azure Monitor is its native observability platform for Azure, supporting metrics, logs, traces, applications and AI workloads. Recent enhancements include the Azure Copilot observability agent for AI-assisted investigations, expanded OTel-based ingestion, SLI/SLO management, dynamic log alerts, cross-region Log Analytics replication and embedded Grafana dashboards. It also includes policy-driven data collection, pipeline-based transformations, Prometheus and OpenTelemetry Protocol (OTLP)-native support, and integrated cost optimization controls for telemetry. Planned enhancements include more autonomous AI agents, deeper Microsoft Foundry integration, and broader OTel-first monitoring across hybrid and multicloud environments.
- Innovation: The Observability agent integration with Azure Copilot provides an integrated, natural-language interface that simplifies complex incident response tasks for platform engineers and SRE teams.
- Geographic and hybrid strategy: Global scale and local data residency across virtually every major region enable Microsoft to meet strict international compliance and data sovereignty requirements.
- Ease of use: “Zero-effort” onboarding for Azure customers provides a competitive advantage for organizations already committed to the Microsoft cloud ecosystem and seeking rapid time to value at scale.
- Multicloud observability: Azure Monitor is less well-suited to observing non-Azure or multicloud workloads, limiting its appeal to organizations prioritizing a “cloud-neutral” observability strategy overall.
- Product strategy: The platform comprises multiple services (Log Analytics, App Insights) that are not yet fully integrated into a cohesive “single pane of glass” compared to Leaders in this Magic Quadrant. This appeals to some buyers, particularly developers, but less to traditional IT operations teams.
- Sales pricing: While base costs are low, high-volume log ingestion and cross-region replication can lead to significant and sometimes unpredictable monthly expenses for large enterprises, particularly without careful cost management.
New Relic
New Relic is a Leader in this Magic Quadrant. Its Intelligent Observability platform spans APM, AI and LLM monitoring, digital experience, infrastructure, network, database, and log management, serving a global base of midsize and large enterprises. Recent enhancements include AI Agent Monitoring, SRE Agent (with AI-assisted workflows), intelligent root cause analysis (iRCA), eBPF-based network metrics, Database 360 and expanded OTel ingestion. The roadmap emphasizes deeper agentic AI capabilities and expanded integrations, including GitHub Copilot and ServiceNow. This includes continued development of its unified telemetry data platform and expanded support for open-standards-based data collection. It also reflects ongoing enhancements to cross-domain visibility across applications, infrastructure and AI-driven workloads.
- Market responsiveness: New Relic provides a sophisticated agentic AI layer that automates complex root cause analysis and log summarization, reducing the cognitive load on SRE teams.
- Telemetry optimization: New Relic’s unified platform ingests high-cardinality telemetry via native OpenTelemetry and eBPF monitoring. Integrated pipelines then optimize ingest costs using edge filtering and tail-based sampling.
- Sales strategy: A strong focus on partner-led GTM through global system integrators (Accenture, NTT DATA) has successfully expanded its reach into the enterprise and public sector markets.
- Market strategy: Intense competition in the agentic AI space means New Relic must continuously innovate to prevent its AI-led differentiation from being commoditized by broader platform giants.
- Pricing model: New Relic recently introduced two new pricing metrics; Compute Capacity Units (CCUs) and Advanced Compute Capacity Units (aCCUs) for AI features. Clients should ensure that they understand the implications of these new metrics, and use tools provided by New Relic to monitor, track and optimize usage.
- Marketing execution: New Relic’s lack of an in-person flagship conference is a notable absence when compared to other Leaders in this Magic Quadrant. New Relic has indicated that its in-person flagship event will resume in 2026.
ScienceLogic
ScienceLogic is a Niche Player in this Magic Quadrant. Its ScienceLogic AI Platform offers Skylar One (observability), Skylar Automation (workflow orchestration), Skylar Compliance (security/compliance) and Skylar AI (AI analysis and advisory). The platform supports SaaS and customer-managed deployments across on-premises and cloud. Recent updates include deeper AI integration, improved visualization, faster UI and new GenAI features like Skylar Advisor and Skylar Analytics dashboards. The roadmap focuses on agentic AI observability and automation.
- Marketing execution: The rebranding to Skylar One, Skylar AI, Skylar Compliance and Skylar Automation provides a more modern, cohesive identity that better reflects ScienceLogic’s evolution toward autonomous operations.
- Product: Strong depth in topology mapping and geographic visualization allows for intuitive impact analysis in complex, distributed infrastructure environments.
- Business model: Providing customers with multiple procurement methods and deployment flexibility (i.e., on-premises, SaaS) makes it a versatile choice for highly regulated or hybrid IT environments.
- Market presence: ScienceLogic is still perceived primarily as an “infrastructure and network-first” solution, which can limit its consideration for modern, code-centric application and tracing deals.
- Offering (product) strategy: Despite the rebrand, some modules like Skylar Compliance (Restorepoint) remain loosely integrated, leading to a fragmented administrative experience for full-suite users.
- Geographic strategy: While global, and with an established footprint in APAC, direct sales and support infrastructure in regions like LATAM and APAC remain less mature than in its core North American and European markets.
SolarWinds
SolarWinds is a Niche Player in this Magic Quadrant. Its SolarWinds SaaS platform provides visibility across applications, infrastructure, databases, networks and digital experience for global customers. Recent updates include expanded OTel-based APM, broader monitoring, improved dashboards, smarter alerting and AI-assisted Root Cause Assist. The roadmap focuses on deeper incident response, alert suppression, workflow automation and expanded agentic AI.
- Market execution: SolarWinds’presence in more than 190 countries and a large network of more than 100 points of presence (POPs) for synthetics ensure robust global visibility for international applications.
- Sales strategy: The vendor’s mature channel ecosystem and platform provide an easy entry point for midmarket and enterprise infrastructure teams seeking consolidated monitoring.
- Market responsiveness: Significant enhancements to OTel tracing and eBPF-based metrics demonstrate a commitment to modernizing its core monitoring technologies for cloud-native workloads.
- Customer experience: SolarWinds customers have reported significant increases in annual renewal costs following the company’s transition to private equity ownership, although pricing specifically for the SaaS Observability product remains unchanged.
- Migration complexity: Transitioning from legacy on-premises deployments to SolarWinds’ SaaS platform requires a new environment. Clients should leverage tooling available from SolarWinds, including Platform Connect, to mitigate transition challenges.
- Product: SolarWinds’ observability platform lacks the breadth of features available from leaders in this market, which may limit deployments in more complex customer environments.
Splunk
Splunk, a Cisco company, is a Challenger in this Magic Quadrant. It operates as the observability and security-focused business unit within Cisco. Its core observability platform offering, Splunk Observability Cloud, covers infrastructure monitoring, APM, digital experience, log analytics and on-call management. The portfolio also includes Splunk Platform, IT Service Intelligence and AppDynamics. Recent released features include an enhanced AI troubleshooting agent, improved visibility into client AI applications and deeper integrations with network visibility.
In April 2026, Cisco announced the acquisition of Galileo, an agent observability and evaluation platform, which it plans to integrate into Splunk’s observability platform.
- Customer services: Splunk has significant investments in client onboarding, services and support with global reach. These help speed time to value for new deployments, as well as multiple channels for client interaction.
- Geographic strategy: Splunk’s investment in regional sovereign cloud and on-premises offerings addresses critical regulatory and data residency requirements for government and high-security clients.
- Sales strategy: Splunk’s extensive global partner network and standardized certifications ensure consistent localized support in all geographies. The widespread availability of certified third-party talent minimizes regional skills gaps and deployment coordination overhead.
- Customer adoption: While integration has improved across the portfolio, further work needs to be done to drive broad customer adoption of the unified observability platform offering. Clients and prospects should gather visibility of the integration roadmap and verify its alignment to their observability journey.
- Innovation: Cisco Data Fabric is a needed step toward a unified enterprise data layer, designed to align Splunk’s offering to future market demand. Success depends on building a network of federated capabilities, tighter telemetry integration and uniting the strengths of Splunk Platform’s unstructured data with the structured data in Splunk Observability Cloud.
- Sales operations: A number of Gartner clients have reported role uncertainty between Cisco and Splunk account teams, particularly in smaller accounts. This lack of clarity has led to delays and increased friction in deployments and renewals at customer accounts.
Vendors Added and Dropped
We review and adjust our inclusion criteria for Magic Quadrants as markets change. As a result of these adjustments, the mix of vendors in any Magic Quadrant may change over time. A vendor's appearance in a Magic Quadrant one year and not the next does not necessarily indicate that we have changed our opinion of that vendor. It may be a reflection of a change in the market and, therefore, changed evaluation criteria, or of a change of focus by that vendor.
Added
The following vendors met the inclusion criteria and have been added to the Magic Quadrant:
- Alibaba Cloud
- HPE
Dropped
- ITRS
- Oracle
- Sumo Logic
Inclusion and Exclusion Criteria
The inclusion criteria are the specific attributes that a provider must have to be included in this Magic Quadrant.
To qualify for inclusion, providers need to satisfy the following criteria:
Market Participation Inclusion Criteria
- Provide generally available capabilities as of 17 March 2026. General availability means the product or service is available to all customers for purchase through normal sales channels.
- Actively market, sell and support a product that provides capabilities as defined in the market definition for observability platforms. Be recognized by the observability platform market, as evidenced by regular appearances on client shortlists, promoting observability platforms by appearances at industry events and by references as a competitor by other vendors.
- Sell the observability platform solution directly to paying customers without requiring them to engage professional services help. The vendor must provide at least first-line support for these capabilities, including any bundled open-source software. This includes but is not limited to comprehensive product documentation, installation guidance and reference examples.
- Demonstrate an active product roadmap, go-to-market and selling strategy for its solutions.
- Have phone, email and/or web customer support. It must offer contract, console/portal, technical documentation and customer support in English (either as the product’s default language or as an optional localization).
Performance Threshold Achievement
- The observability platform offering must have at least 50 paying, production (non-beta-test) customers in at least each of two or more geographic regions (APAC, EMEA, LATAM or North America), excluding sales to MSPs.
- The observability platform offering must have generated at least $75 million in annual generally accepted accounting principles (GAAP) revenue during the prior year.
Or:
- The observability platform offering must have generated a minimum of $10 million in annual revenue, combined with a growth rate of at least 25% in the 12 calendar months prior to the receipt of this letter, compared to its previously completed 12-month period.
Revenue figures must be reported in USD constant currency.
Honorable Mentions
ClickHouse (ClickStack): ClickHouse has expanded from providing an analytical database used by other vendors to offering a first-party observability solution. Following its March 2025 acquisition of HyperDX, the vendor launched ClickStack, an open-source observability stack that integrates logs, metrics, traces and session replay directly with the ClickHouse engine. ClickStack enables AI agents and engineers to perform investigations on unsampled telemetry with long-term retention at scale. In January 2026, ClickHouse acquired Langfuse, an open-source platform for LLM observability, extending these capabilities with specialized tracing, evaluation and monitoring for GenAI applications and agents. This strategy aims to consolidate different telemetry types onto a single high-performance data store, targeting enterprises that require high-cardinality analysis and cost-effective data retention.
Dash0: Dash0, founded by the creators of Instana (acquired by IBM), provides an OTel-native observability platform built on ClickHouse. The vendor distinguishes itself with a developer-centric interface and a simplified, consumption-based pricing model that avoids per-host or per-user fees. In February 2026, Dash0 acquired Lumigo, integrating specialized AWS-native, serverless and LLM observability capabilities into its stack. Following a $110 million Series B in March 2026, the company has pivoted toward agentic observability with its Agent0 framework, using autonomous AI agents to perform root-cause analysis and remediation.
groundcover: groundcover offers a “bring-your-own-cloud” (BYOC) architecture for organizations prioritizing data residency, storing telemetry in private ClickHouse and VictoriaMetrics instances within the customer’s perimeter. Using eBPF for zero-code instrumentation or OpenTelemetry, the platform has recently expanded to include real user monitoring (RUM) and AI-native troubleshooting tools. The vendor’s focus on data sovereignty and autonomous agentic observability remains a notable alternative for cloud-native enterprises.
ITRS: ITRS provides a real-time monitoring and observability platform, led by its flagship offerings Geneos, Opsview and Uptrends, with a focus on financial services and regulated environments. In early 2026, ITRS acquired ip-label, a DEM specialist, to integrate the Ekara platform and strengthen its synthetic and real-user monitoring capabilities. Recent updates include the introduction of an agentic AI site reliability engineer for automated incident triage and expanded OTel support. ITRS continues to focus on high-scale operational resilience and unified monitoring for mission-critical infrastructure.
Observe by Snowflake: Observe was among the first observability vendors to architect its platform on a data lakehouse foundation powered by the Snowflake AI Data Cloud platform. Recognized as a Gartner Cool Vendor in 2021, the company focuses on an analytics-driven approach that relates telemetry data through its “Context Graph” technology for AI-native troubleshooting workflows. In early 2026, Snowflake acquired Observe, signaling a strategic move to integrate native observability and performance monitoring directly into the Snowflake AI Data Cloud. This transition aims to leverage Observe’s AI-powered observability to provide Snowflake customers with a unified environment for managing high-scale machine data and operational analytics.
Virtana: Virtana provides hybrid infrastructure and application observability with an emphasis on full-stack root-cause clarity and cost optimization. Following its May 2025 acquisition of Zenoss, Virtana integrated service-centric topology mapping and event intelligence into its core platform. In March 2026, Virtana introduced its Application Observability offering, featuring an AI-native architecture designed to extend monitoring past legacy, code-centric APM boundaries. This update unifies telemetry from application code down through Kubernetes, infrastructure, storage and specialized AI workloads, utilizing agentic AI to map complex dependencies and deliver automated, evidence-based triage.
Evaluation Criteria
Ability to Execute
Gartner analysts evaluate vendors on the quality and efficacy of the processes, systems, methods or procedures that enable provider performance to be competitive, efficient and effective, and to positively impact revenue, retention and reputation. Ultimately, vendors are judged on their ability and success in capitalizing on their vision.
Product: This looks at the core observability technologies that compete in the observability platform market, including current product capabilities, quality and feature sets. Additional consideration is given to the vendor’s scalability, availability and integration, as well as its security features.
Overall viability: This criterion includes an assessment of the organization’s overall financial health, as well as the financial and practical success of the business unit. Considerations include profitability, geographic distribution of revenue and R&D spending.
Sales execution/pricing: This covers the assessment of a vendor’s success in the market. Vendors’ pricing models and proposals are compared for value and complexity, as well as pricing transparency. Considerations include pricing and discounting, new versus repeat business, and competitive dynamics, including awareness of competitors.
Market responsiveness: This criterion looks at a vendor’s ability to respond and change direction based on the evolution of customer needs and changes in market dynamics. Considerations include response to competitors and the ability to listen and respond to customer feedback.
Marketing execution: This looks at the clarity, quality, creativity and efficacy of programs designed to deliver the vendor’s message in order to influence the market, promote the brand, increase awareness of products and establish a positive identification in the minds of customers.
Customer experience: This covers the products and services and/or programs that enable customers to achieve anticipated results with the products evaluated. This may also include ancillary services, customer support programs and availability of user groups. Considerations include postsales support, programs for high-touch or VIP customers, and specific delivery partners in a given region.
Operations: This criterion looks at the ability of the vendor to meet goals and commitments. Factors include quality of the organizational structure, skills and relationships, and their ability to meet service-level agreements. Considerations include partnerships with cloud providers, outages that affect customers and SLA adherence.
Ability to Execute Evaluation Criteria
| Evaluation Criteria | Weighting |
|---|---|
Product or Service | High |
Overall Viability | Medium |
Sales Execution/Pricing | High |
Market Responsiveness/Record | High |
Marketing Execution | High |
Customer Experience | High |
Operations | Low |
Source: Gartner (July 2026)
Completeness of Vision
Gartner analysts evaluate vendors on their ability to understand current market opportunities and create and articulate their vision for future market direction, innovation, customer requirements and competitive forces. Ultimately, vendors are rated on their vision for the future, and how well that maps to Gartner’s position.
Market understanding: This criterion considers a vendor’s ability to understand customer needs and translate them into products. Vendors that show a clear vision of their market listen, understand customer demands, and can shape or enhance market changes with their added vision. Consideration is given to understanding the rapidly evolving observability landscape and how it is distinguished from APM.
Marketing strategy: This criterion looks for clear, differentiated messaging consistently communicated internally and externalized through social media, advertising, customer programs and positioning statements. Consideration is given to new market outreach, innovative marketing initiatives and true differentiation.
Sales strategy: This criterion considers whether the vendor has a sound strategy for selling that uses the appropriate networks, including direct and indirect sales, marketing, service, communication, and partners that extend the scope and depth of market reach, expertise, technologies and the vendor’s customer base. Consideration is given to channel strategy and understanding the buyers and influencers involved in selection of observability platform products.
Offering (product) strategy: This criterion evaluates whether a vendor’s approach to product development and delivery emphasizes market differentiation, functionality, methodology and features that cover current and future requirements. Consideration is given to quality and cadence of vendors’ product roadmap and investment priorities into adjacent market segments within the IT operations management (ITOM) landscape.
Business model: This criterion looks at the design, logic and execution of the vendor’s business proposition to achieve continued success. Consideration is given to vendors’ business, value proposition, ability to anticipate shifts in licensing/pricing models and relationship with open-source communities.
Vertical/industry strategy: As observability platforms tend not to be industry-specific, evaluating these in detail is not a key element of this research. Where vertical or industry differentiation is relevant, questions are included in other criteria categories.
Innovation: This criterion looks at direct, related, complementary and synergistic layouts of resources, and expertise or capital for investment, consolidation, defensive or preemptive purposes. Consideration is given to the level of investment in product development in new areas related or adjacent to observability, third-party and partner relationships and integrations, and use of AI/ML and other novel capabilities.
Geographic strategy: This criterion looks at the provider’s strategy to direct resources, skills and offerings to meet the specific needs of geographies outside its “home” or native geography, either directly or through partners, channels and subsidiaries, as appropriate for that geography and market. Additional consideration is given to the number of employees allocated to different regions, locations of SaaS delivery platforms, tailoring of go-to-market or product strategy to address regional differences, and the depth and scope of partners available in countries with existing and new customers.
Completeness of Vision Evaluation Criteria
| Evaluation Criteria | Weighting |
|---|---|
Market Understanding | High |
Marketing Strategy | Medium |
Sales Strategy | Medium |
Offering (Product) Strategy | High |
Business Model | High |
Vertical/Industry Strategy | NotRated |
Innovation | High |
Geographic Strategy | Medium |
Source: Gartner (July 2026)
Quadrant Descriptions
Leaders
Leaders provide observability platform products that are a strong functional match to general market requirements, and they are among the most successful in building and expanding their customer base. They have comprehensive portfolios that offer superior analytics and visibility, and have broad integration with other ITOM technologies. Leaders demonstrate evidence of superior vision and execution for emerging and anticipated market requirements, as well as a consistent track record of innovation and customer experience.
Challengers
Challengers demonstrate broad market reach and large observability platform deployments. Vendors in this quadrant typically have strong execution capabilities and a significant sales and brand presence garnered from the company as a whole, if not directly from its observability-related activities. Some vendors previously may have been among the top performers in the market and, thus, offer broad product portfolios. Challengers may be transforming their product offerings and market focus. In some cases, their offerings are positioned as elements of a larger solution that may even extend beyond the boundaries of ITOM.
Visionaries
Visionaries provide observability platform products and have built a compelling plan to competitively address observability platform market requirements, but with a product portfolio that may still be a work in progress. They have a lower Ability to Execute than the Leaders. This is typically due to a lower ability to respond to market conditions, bring together the necessary product and platform requirements, and effectively gain and expand market share.
Niche Players
Niche Players comprise primarily, but not exclusively, vendors with observability platform solutions that cater to specific audiences or offer limited use-case support. Because they do not demonstrate equal depth across all core capabilities, they typically do not meet the observability needs of the broader market, or they may do so within specific verticals or market segments or geographic regions only. In addition, Niche Players may have a more limited ability to invest in the necessary functional and sales and marketing capabilities to expand beyond their current focus. Inclusion in this quadrant does not reflect negatively on Niche Players’ value in the markets in which they compete.
Context
Observability platforms have evolved from infrastructure monitoring into a strategic capability underpinning digital resilience, developer productivity and modern IT operations. This Magic Quadrant evaluates vendors offering unified platforms spanning telemetry collection, analysis and action across cloud-native, hybrid and on-premises environments, including vendors’ ability to support AI workloads and agentic systems.
Buyers should use this research alongside the accompanying Critical Capabilities for Observability Platforms, which provides detailed scoring across multiple use cases. The Magic Quadrant reflects the needs of large enterprises and midsize organizations globally.
Market consolidation currently continues to favor platform-oriented vendors delivering full-stack observability with integrated AI capabilities. Clients are encouraged to evaluate vendors on roadmap credibility for AI-driven observability, OTel interoperability, and the capacity to observe and govern AI agents, rather than defaulting to market position alone.
Market Overview
The observability market in 2026 is characterized by growing tensions between technical aspirations and operational constraints. The emergence of AI architectures challenges traditional approaches to observability, and the industry’s shift toward autonomous operations remains limited. The market is moving toward greater scrutiny of the actual ROI of the agentic systems, where the value of autonomous investigative tools may be offset by their complexity, cost and overall accuracy.
Organizations are centralizing their observability practices to manage the complexities of multicloud environments and the significant telemetry overhead from GenAI workloads. Despite this, the market continues to expand. Gartner projects the observability market to reach $14.3 billion by 2028. However, this growth is increasingly driven by managing telemetry volume rather than the adoption of advanced AI features.
Key factors influencing the market in 2026 include:
- Agentic AI gap: The transition from generative AI assistants to autonomous agents is more complex than vendor marketing suggests. While many platforms now market autonomous investigators, which are capable of cross-domain root-cause analysis, Gartner finds consistent and verifiable results remain elusive for most enterprises.
- Observability pipelines: Cost often remains the primary friction point for observability adoption. To help control these expenses, organizations are increasingly deploying pipelines to filter, mask and route telemetry before it reaches expensive analytics backends. Pipeline management is becoming a strategic layer. Observability platform vendors need to offer more sophisticated capabilities to prevent customer churn to vendor-agnostic alternatives.
- Commoditization via open standards: Telemetry collection has moved beyond APM agents and has largely become a commodity. The growing adoption of OTel and eBPF-based instrumentation has lowered (but not removed) the barrier to switching platforms. Vendors must now differentiate through analytics and user experience. Gartner clients frequently mention that “OTel-native” is a baseline requirement.
- LLM and AI-workload observability: LLM, AI and agentic AI observability is emerging as a new key requirement with high interest from clients, yet adoption remains low. The needs of enterprise buyers is rapidly changing to include visibility into token usage, model latency and specific GenAI measures like hallucination rates. Gartner expects to see increased acquisition activity, as established vendors look to fill gaps in their portfolios, though this leaves the risk of leaving many organizations with fragmented visibility into their AI stack.
- FinOps: With 5% of Gartner clients now spending more than $10 million per year on a single provider, observability is no longer shielded from financial oversight. Organizations are applying FinOps principles, demanding better visibility and accountability. Platforms will need to improve their cost attribution and other financial ROI metrics that help CFOs and procurement teams understand the business impact of observability.
Acronym Key and Glossary Terms
| APAC | Asia/Pacific |
| APM | Application performance monitoring |
| CI/CD | Continuous integration/continuous delivery |
| CMDB | Configuration management database |
| DEM | Digital experience monitoring |
| eBPF | Extended Berkeley packet filter |
| EMEA | Europe, Middle East and Africa |
| ITSM | IT service management |
| LATAM | Latin America |
| MSP | Managed service provider |
| OpAMP | Open Agent Management Protocol |
| RBAC | Role-based access control |
| SI | System integrator |
| SLI | Service-level indicator |
| SLO | Service-level objective |
| SRE | Site reliability engineer |
| VAR | Value-added reseller |
This research is based on more than 1,000 customer interactions over the past 12 months. In addition, as part of our analysis, we have collected information from Gartner Peer Insights, client inquiries and publicly available sources to supplement the information provided by participating vendors.
Ability to Execute
Product/Service: Core goods and services offered by the vendor for the defined market. This includes current product/service capabilities, quality, feature sets, skills and so on, whether offered natively or through OEM agreements/partnerships as defined in the market definition and detailed in the subcriteria.
Overall Viability: Viability includes an assessment of the overall organization's financial health, the financial and practical success of the business unit, and the likelihood that the individual business unit will continue investing in the product, will continue offering the product and will advance the state of the art within the organization's portfolio of products.
Sales Execution/Pricing: The vendor's capabilities in all presales activities and the structure that supports them. This includes deal management, pricing and negotiation, presales support, and the overall effectiveness of the sales channel.
Market Responsiveness/Record: Ability to respond, change direction, be flexible and achieve competitive success as opportunities develop, competitors act, customer needs evolve and market dynamics change. This criterion also considers the vendor's history of responsiveness.
Marketing Execution: The clarity, quality, creativity and efficacy of programs designed to deliver the organization's message to influence the market, promote the brand and business, increase awareness of the products, and establish a positive identification with the product/brand and organization in the minds of buyers. This "mind share" can be driven by a combination of publicity, promotional initiatives, thought leadership, word of mouth and sales activities.
Customer Experience: Relationships, products and services/programs that enable clients to be successful with the products evaluated. Specifically, this includes the ways customers receive technical support or account support. This can also include ancillary tools, customer support programs (and the quality thereof), availability of user groups, service-level agreements and so on.
Operations: The ability of the organization to meet its goals and commitments. Factors include the quality of the organizational structure, including skills, experiences, programs, systems and other vehicles that enable the organization to operate effectively and efficiently on an ongoing basis.
Completeness of Vision
Market Understanding: Ability of the vendor to understand buyers' wants and needs and to translate those into products and services. Vendors that show the highest degree of vision listen to and understand buyers' wants and needs, and can shape or enhance those with their added vision.
Marketing Strategy: A clear, differentiated set of messages consistently communicated throughout the organization and externalized through the website, advertising, customer programs and positioning statements.
Sales Strategy: The strategy for selling products that uses the appropriate network of direct and indirect sales, marketing, service, and communication affiliates that extend the scope and depth of market reach, skills, expertise, technologies, services and the customer base.
Offering (Product) Strategy: The vendor's approach to product development and delivery that emphasizes differentiation, functionality, methodology and feature sets as they map to current and future requirements.
Business Model: The soundness and logic of the vendor's underlying business proposition.
Vertical/Industry Strategy: The vendor's strategy to direct resources, skills and offerings to meet the specific needs of individual market segments, including vertical markets.
Innovation: Direct, related, complementary and synergistic layouts of resources, expertise or capital for investment, consolidation, defensive or pre-emptive purposes.
Geographic Strategy: The vendor's strategy to direct resources, skills and offerings to meet the specific needs of geographies outside the "home" or native geography, either directly or through partners, channels and subsidiaries as appropriate for that geography and market.