Critical Capabilities for Observability Platforms
13 July 2026 - ID G00840254 - 39 min read
By Martin Caren, Padraig Byrne, and 2 more
Observability platforms deliver insights into system health and performance to drive business results. With new advances addressing costs and agentic AI, heads of I&O and I&O leaders should use this research to identify the vendors that align with their requirements.
Overview
Key Findings
- Observability platforms now emphasize advanced telemetry management, cost optimization, and support for “bring your own cloud/storage” (BYOC/BYOS) to enhance data control and compliance.
- Agentic AI is emerging as a key differentiator, enabling platforms to support autonomous agents for issue detection, investigation, and remediation with minimal human input.
- The focus is shifting from interactive exploration to automation, with AI delivering actionable insights and supporting cross-domain, closed-loop incident response.
- AI/LLM and agentic observability are emerging as critical capabilities for organizations seeking to ensure safe, trustworthy, and aligned operations as they scale AI and autonomous workloads.
Recommendations
- Maximize business value and operational autonomy by investing in observability platforms with advanced telemetry, agentic AI, and automated response.
- Control observability costs by evaluating platforms with strong cost controls, transparent pricing, and BYOC/BYOS options.
- Enhance productivity and resilience by choosing solutions that enable interactive exploration, actionable insights, “human-on-the-loop” operations, closed-loop workflows, and cross-silo investigation to minimize downtime and accelerate remediation.
- Support responsible and scalable AI adoption by selecting observability platforms that monitor AI, LLM, and agentic workloads for semantic risks such as hallucination, bias, reasoning drift, and unintended agent actions.
What You Need to Know
This document was revised on 23 July 2026. The document you are viewing is the corrected version. For more information, see the Corrections page on gartner.com.
As businesses become increasingly digitized, mobile and web applications have become the primary, if not the only, touchpoints between customers and enterprises.
These applications are now critical drivers of business outcomes, influencing everything from revenue generation to customer satisfaction and engagement. Ensuring the resilient and reliable operation of these already complex and distributed applications has become even more challenging thanks to the addition of generative and agentic AI-based features. These features need monitoring not only for performance but also to manage and mitigate the inherent risks associated with LLMs and autonomous agents. As a result, observability platforms are evolving to play a critical role in AI governance, providing visibility, accountability, and control over AI-driven behaviors within applications.
For heads of I&O, observability platforms are essential tools that provide deep visibility into the behavior of complex, distributed IT systems. Their core function is to help I&O teams proactively monitor, analyze, and optimize application health and performance. Modern observability platforms correlate technical telemetry with business outcomes and leverage AI, including agentic AI, to enable teams to detect anomalies, reduce downtime, and make data-driven decisions that directly impact business outcomes and operational efficiency.
This research focuses on the relative strengths of observability platforms with respect to key functional dimensions and use cases rather than the overall strengths and weaknesses of the vendors themselves. This analysis complements Magic Quadrant for Observability Platforms, which defines the market and highlights a broad set of factors, including corporate viability, vision, marketing, and the geographic focus of the vendors offering these products. We recommend that organizations use this research in conjunction with the Magic Quadrant, inquiries with Gartner analysts, and other Gartner research to define their requirements and select the observability platform that best matches their needs.
Analysis
Critical Capabilities Use-Case Graphics
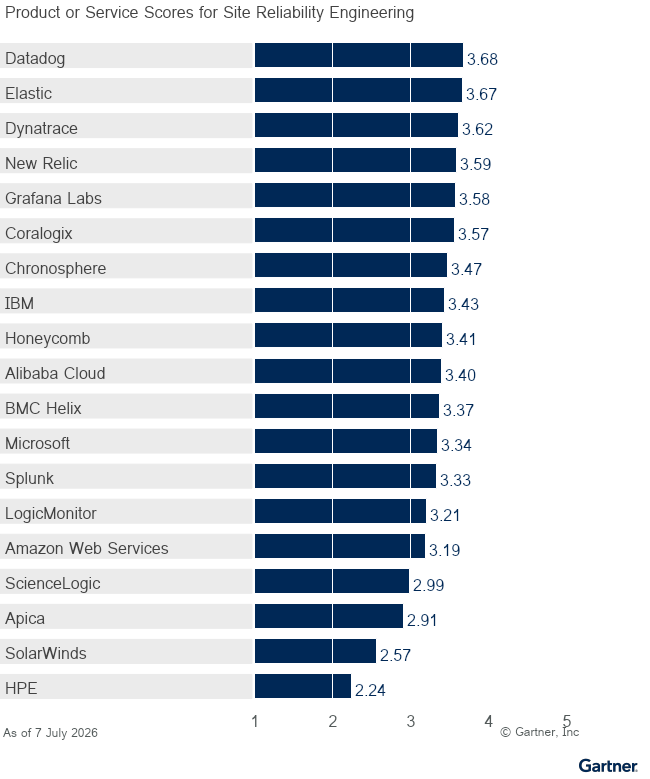
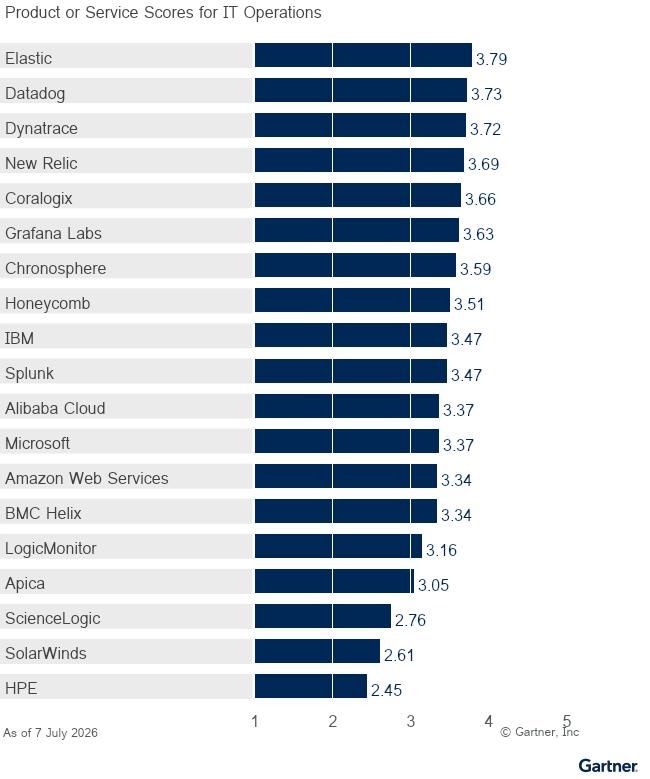
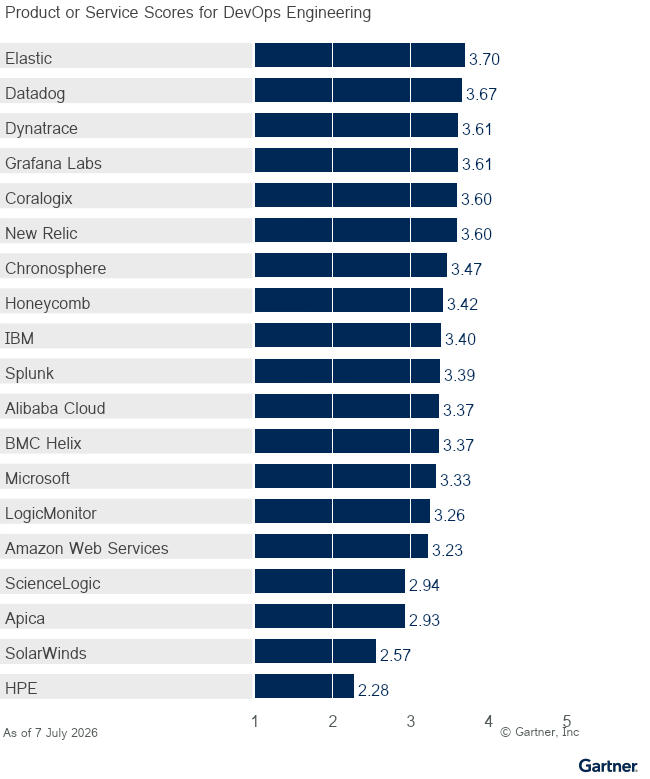
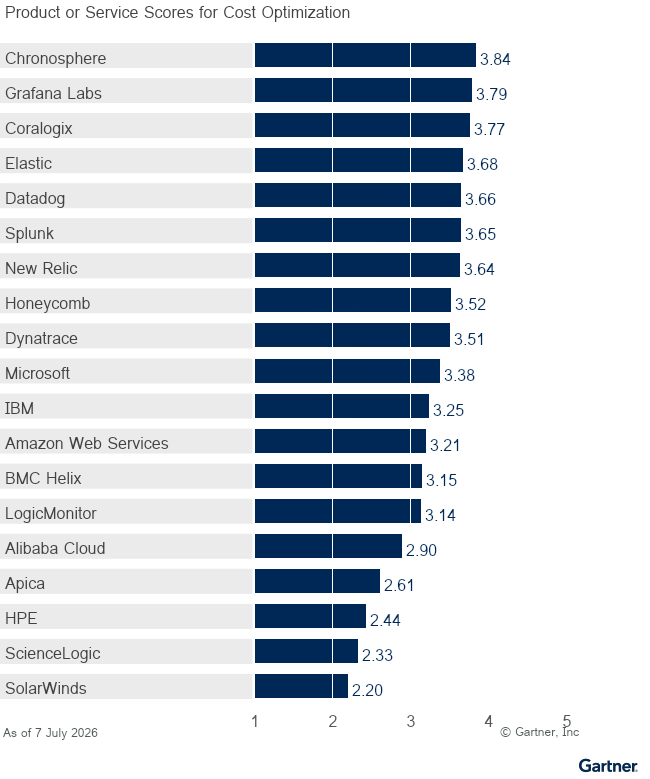
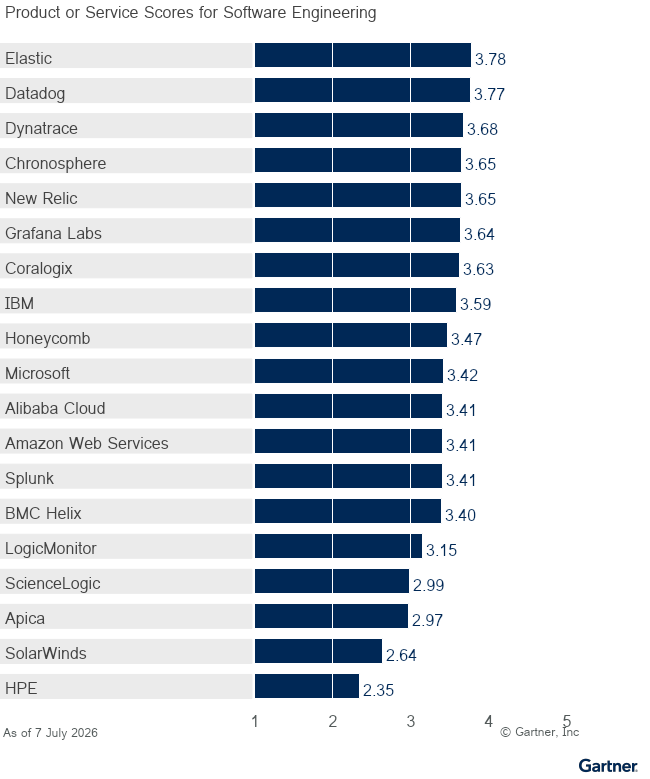
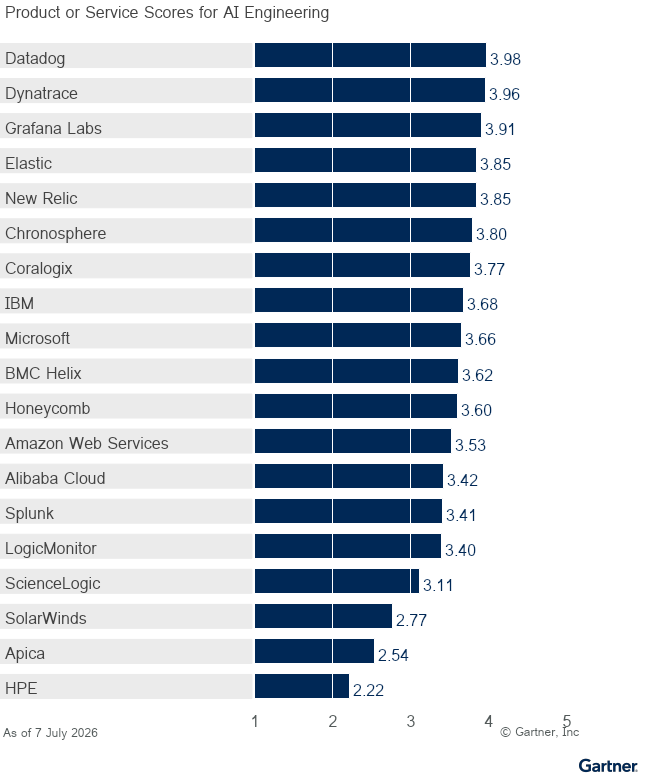
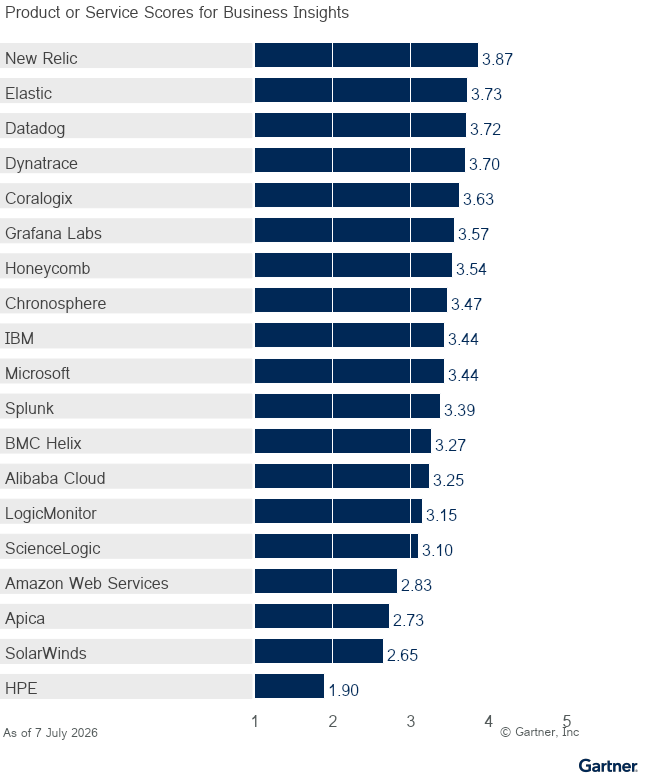
Vendors
Alibaba Cloud
Alibaba Cloud’s observability platform, Cloud Monitor 2.0, unifies metrics, logs, and traces within a single platform. It supports OTel-compatible ingestion and integrates monitoring, log analytics, and application performance data for Alibaba Cloud services. UModel provides a topology framework to correlate telemetry across infrastructure, applications, and containers, supported by dashboards, alerting, and policy-based configuration.
The platform aligns best with AI engineering and software engineering by supporting trace-level analysis, service mapping, and the investigation of complex application behavior. These capabilities also support site reliability engineering through topology-aware correlation, anomaly detection, and centralized alerting. Cost optimization is the main area for improvement, as it relies more on configuration than on built-in analytics.
The platform best suits engineering- and operations-focused organizations running Alibaba Cloud, including hybrid deployments, with a focus on reliability and incident resolution.
Amazon Web Services
See verified user reviews and ratings for Amazon Web Services on Peer Insights.
AWS observability includes Amazon CloudWatch, DevOps Agent, Amazon OpenSearch Service, Amazon Managed Service for Prometheus, and Amazon Managed Grafana. These services collectively ingest, store, and analyze metrics, logs, and traces across AWS, with support for multicloud and on-premises sources through OTel-based instrumentation and managed services. However, the platform’s native analytics and automated correlations are most performant when applied to AWS-resident workloads, requiring manual configuration for non-AWS environments.
AWS’ strongest use case is in AI engineering, with functionality focused on monitoring and troubleshooting AI-enabled workloads in complex, distributed environments. Opportunities for improvement include cost optimization and business insights.
The offering is well-aligned with organizations building and operating cloud-native and model-driven applications that require operational visibility within AWS environments. It is also suited to organizations seeking to standardize observability within AWS service operations and cloud management practices.
Apica
See verified user reviews and ratings for Apica on Peer Insights.
Apica Ascent is an observability platform composed of Apica Fleet for agent management, Flow for telemetry processing, Lake for storage, and Observe for visualization and alerting. Its modular data fabric separates ingestion, processing, storage, and analysis, and supports SaaS or self-hosted deployment across hybrid and cloud-native environments with diverse telemetry formats.
Apica Ascent’s strongest alignment is with IT operations, supported by centralized agent management and policy-based telemetry handling. Its biggest areas for improvement are in business insights, cost optimization, and AI engineering, where analytics and optimization functionality is less developed.
Apica Ascent is best-suited for IT operations, where standardized telemetry ingestion and agent life cycle control support operational monitoring. The platform fits organizations seeking open-standards-based observability and flexible integration, especially in environments prioritizing consistent telemetry management over advanced analytics or optimization.
BMC Helix
BMC Helix Observability & AIOps provides observability, asset discovery, and service operations on a unified platform for enterprises. It can serve as a full IT operations solution with BMC Helix ITSM or integrate with existing tools to collect and analyze telemetry across hybrid and multicloud infrastructure. The platform correlates operational signals with service context to support investigation and response for modern and legacy systems.
The platform’s strengths are in AI engineering, where agent-driven analysis, natural language investigation, and reasoning-based workflows help examine and respond to complex, nondeterministic system behavior through governed operational execution. Cost optimization remains an area for improvement, as capabilities for cost visibility and control of data collection and retention are still maturing.
BMC Helix is suited to environments where investigation and response are embedded within established operational processes and shared responsibility. It fits enterprises that favor centralized oversight, governed execution, and integration with IT service management to coordinate engineering and operations activities at scale.
Chronosphere
See verified user reviews and ratings for Chronosphere on Peer Insights.
Chronosphere’s observability platform (recently acquired by Palo Alto Networks) is built for large, distributed application environments. Delivered as SaaS, it features a centralized cost optimization engine and integrated observability pipeline for processing metrics, logs, and traces. The platform includes AI-Powered Guided Troubleshooting based on a Temporal Knowledge Graph for investigation and root cause analysis.
Cost optimization is Chronosphere’s strongest use case, focusing on governing telemetry usage, reducing data volumes, and improving cost transparency at scale. The platform is also strong in the AI engineering, software engineering, and IT operations use cases. Support for business insights is more limited, with less emphasis on business-level analytics.
Chronosphere is best-suited for organizations where controlling telemetry scale and cost is a primary objective, and for teams managing technically complex systems that prioritize system reliability, investigation workflows, and operational efficiency.
Coralogix
See verified user reviews and ratings for Coralogix on Peer Insights.
Coralogix delivers a SaaS observability platform built on streaming analytics, processing telemetry as it is ingested. It unifies logs, metrics, traces, and events, enabling direct querying on retained data via a flexible analytics model and open data lake. This supports real-time insights and customer control over storage and retention across distributed environments.
Coralogix’s strongest alignment is with cost optimization, offering robust capabilities for controlling data usage and optimizing telemetry costs. It also aligns well with AI engineering, offering visibility into complex, data-intensive systems through multidomain telemetry correlation. Coralogix’s lowest score was in the site reliability engineering use case.
Coralogix suits organizations running complex, modern environments needing a single platform for multiple engineering practices, valuing deep analysis, operational transparency, and data control over tightly prescribed automation workflows.
Datadog
See verified user reviews and ratings for Datadog on Peer Insights.
Datadog’s SaaS observability platform centralizes the collection and analysis of metrics, logs, traces, and events. Its cloud-native architecture enables broad instrumentation across applications and infrastructure, supporting telemetry correlation and visibility across distributed, dynamic environments.
Datadog is strongest in AI engineering, offering deep observability and AI-assisted investigation for complex, data-driven systems. Cost optimization is also a notable strength, with robust capabilities for managing telemetry data and controlling observability spend. The platform provides solid support for software engineering. The main area for improvement is DevOps engineering, which is the lowest-scoring use case.
Datadog is well-suited for organizations operating modern, cloud-centric environments that require a single platform to support multiple engineering and operational practices. It best fits teams that depend on deep investigation, cross-domain visibility, and shared operational context across engineering and reliability functions.
Dynatrace
See verified user reviews and ratings for Dynatrace on Peer Insights.
Dynatrace delivers a unified observability platform integrating metrics, logs, traces, events, user sessions, code-level, and topology data in the Grail data lakehouse. Smartscape provides a real-time dependency graph for contextual insight, automatically populated by OneAgent- and OTel-observed runtime behavior and APIs. The platform is available as SaaS or self-hosted, supporting cloud-native, hybrid, and regulated environments, with some feature differences by deployment.
Dynatrace’s strongest use case is AI engineering, with deep telemetry correlation, causal analysis, and end-to-end visibility into AI and application workloads. The main area for improvement is cost optimization, which, while still strong, is the lowest-scoring use case relative to others.
Dynatrace best suits enterprises running mid- to large-scale, complex, and AI-intensive environments requiring unified visibility across development and operations. It also fits organizations that require a self-hosted option for data residency or control requirements and are comfortable with limitations in available capabilities between deployment models.
Elastic
See verified user reviews and ratings for Elastic on Peer Insights.
Elastic Observability is available as a cloud, serverless, or self-hosted platform built on the Elastic Stack, combining Elasticsearch, Kibana, and a search-based data lake. It ingests logs, metrics, traces, and events via Elastic Agents and OTel collectors, with centralized policy control and life cycle management through Elastic Fleet for hybrid and cloud environments.
Elastic is strongest in AI engineering and IT operations, enabling the correlation of infrastructure, service, and application telemetry to investigate operational conditions across distributed systems. Support for software engineering, DevOps engineering, and business insights is solid, offering broad visibility and flexible analytics. Opportunities remain for Elastic to further expand telemetry governance and cost optimization capabilities for organizations operating at significant scale and complexity.
Elastic is best-suited for complex, distributed, or cloud-native environments needing flexible ingestion and high-cardinality analysis. It fits teams prioritizing open standards and search-driven investigation, and that can leverage built-in platform capabilities with disciplined practices to govern data growth and costs.
Grafana Labs
See verified user reviews and ratings for Grafana on Peer Insights.
Grafana Labs provides an observability platform built around Grafana Cloud and its open-source ecosystem. It supports metrics, logs, traces, and profiles using separate backends such as Grafana Mimir, Grafana Loki, Grafana Tempo, and Grafana Pyroscope, with signals unified through Grafana Cloud’s visualization layer, and cross-signal correlation enriched by a knowledge graph of service dependencies. The platform is OpenTelemetry-native, supporting standard collectors, direct OTLP ingestion, and Grafana Alloy, enabling use across cloud-native and hybrid environments.
Grafana’s strengths are in the cost optimization and AI engineering use cases. Adaptive telemetry controls enable efficient management of data volume and cost, while OpenTelemetry-native ingestion and a composable architecture provide flexibility in how telemetry is collected and analyzed. The main area for improvement is business insights, which is the lowest-scoring use case.
Grafana Labs is most suitable for organizations that value open architectures and flexible telemetry analysis. It fits especially well for platform operations and software engineering teams that need visibility and investigative depth while retaining control over observability spend.
Honeycomb
Honeycomb provides an observability platform designed for deep analysis of high-cardinality telemetry. It treats telemetry as structured events stored in a unified datastore, allowing engineers to add context freely and explore system behavior without heavy upfront schema design. The platform emphasizes understanding what changed during an incident rather than relying on predefined dashboards.
Honeycomb’s strongest scores are in cost optimization, AI engineering, and business insights, reflecting its strengths in event-level analysis, deterministic sampling, and its “BubbleUp” feature. These features enable cost control alongside deep investigative workflows. The main area for improvement is site reliability engineering, which is the lowest-scoring use case.
Honeycomb is most suitable for software engineering and AI engineering teams that need to explain complex or unfamiliar behavior. It works best in environments where teams prefer human-led diagnosis and learning rather than automated remediation.
HPE
See verified user reviews and ratings for HPE on Peer Insights.
HPE delivers observability through OpsRamp, a service-centric operations platform that combines infrastructure and application monitoring with incident management, automation, and ITSM. OpsRamp is designed for hybrid IT environments and supports on-premises systems, cloud services, and Kubernetes through agents, OpenTelemetry collectors, and agentless integrations.
HPE OpsRamp most closely aligns with the IT operations use case, reflecting its strengths in centralized governance and process-driven automation for broad hybrid environments. The main area for improvement is business insights, which is the lowest-scoring use case and highlights limited support for business-level analytics and reporting.
OpsRamp is most suitable for large enterprises that prioritize centralized governance and process-driven automation. It fits best for IT and platform operations teams managing broad hybrid environments where coordination and control matter more than deep developer-focused observability.
IBM
IBM delivers observability through the Instana platform, available as both SaaS and self-hosted software. Instana focuses on application and infrastructure monitoring and captures full-fidelity traces and high-resolution metrics by default. It supports Kubernetes, microservices, and traditional enterprise platforms.
Its strengths are in the AI engineering, software engineering, and IT operations use cases, where deterministic root cause analysis and full-fidelity telemetry enable precise identification of failure causality across complex systems. Cost optimization is an area for improvement. Cost can scale predictably with always-on high-volume data collection, but can increase cost pressure without strong native optimization controls.
IBM Instana is most suitable for enterprises operating across modern and legacy platforms that require precise root cause analysis and clear service impact. It works well for operations and reliability teams that prioritize transparency and governed automation, particularly where a more deterministic approach is preferred over highly autonomous remediation.
LogicMonitor
See verified user reviews and ratings for LogicMonitor on Peer Insights.
LogicMonitor delivers hybrid observability through its LM Envision platform, collecting telemetry across on-premises, cloud, network, and containerized environments. It uses standard protocols, APIs, and collectors for telemetry, with Catchpoint integration extending visibility to internet performance and synthetic user journeys.
LogicMonitor’s highest scores were in the AI engineering and DevOps engineering use cases, where AI-driven investigation and broad telemetry ingestion help correlate signals across hybrid environments. The main area for improvement is business insights, which is one of its lowest-scoring use cases, indicating more limited support for business-level analytics and reporting.
LogicMonitor is best-suited for IT and platform operations teams managing large hybrid environments, especially with significant network and legacy infrastructure. Its agentless collection reduces instrumentation overhead, with OpenTelemetry integration included but not central to the platform’s architecture. The platform fits organizations prioritizing broad infrastructure visibility and operational context over deep developer-centric debugging.
Microsoft
See verified user reviews and ratings for Microsoft on Peer Insights.
Microsoft’s observability platform, Azure Monitor, is a SaaS-only solution and a foundational tool for organizations in the Microsoft ecosystem, including select hybrid environments. It provides native, high-fidelity visibility into cloud-hosted workloads and remains deeply integrated with the broader Azure suite. Azure Monitor offers seamless scalability, robust security features, and flexible data retention options.
Azure Monitor’s strongest use case is AI engineering, where it provides integrated telemetry pipelines and advanced observability for AI and LLM workloads. Cost optimization and business insights are also notable strengths, supported by seamless integration with Azure services and robust analytics for cloud-hosted environments. The main area for improvement is DevOps engineering, which is the lowest-scoring use case.
Azure Monitor is best-suited for organizations operating primarily within the Microsoft ecosystem that require high-fidelity visibility, scalable observability, and deep integration with Azure-native tools and services.
New Relic
See verified user reviews and ratings for New Relic on Peer Insights.
New Relic’s usage-based observability platform unifies metrics, logs, and traces, supporting advanced monitoring and automation across cloud environments. The platform offers seamless integration with popular cloud providers, robust security and compliance features, and flexible agent deployment options, making it an ideal choice for enterprises seeking scalable, end-to-end SaaS observability and actionable insights across modern application stacks. The latest suite introduces the Agentic Platform and SRE agent, enabling guided triage and resolution within the engineering life cycle. Features like Intelligent Workloads and AI Monitoring provide deep insights for debugging LLM applications and linking system health to business outcomes.
New Relic’s strengths are in the AI engineering, business insights, and cost optimization use cases, where its high-fidelity AI monitoring, ability to link system health to business outcomes, and granular control over data ingestion costs provide comprehensive value. The main area for improvement is site reliability engineering, which is the lowest-scoring use case.
New Relic’s strengths are in the AI engineering, business insights, and cost optimization use cases, where its high-fidelity AI monitoring, ability to link system health to business outcomes, and granular control over data ingestion costs provide comprehensive value. The main area for improvement is site reliability engineering, which is the lowest-scoring use case.
New Relic is best-suited for organizations prioritizing digital experience, AI engineering, and comprehensive observability in dynamic, multicloud environments.
ScienceLogic
See verified user reviews and ratings for ScienceLogic on Peer Insights.
ScienceLogic’s AI Platform combines Skylar One observability with the Skylar AI suite (Advisor and Analytics) to deliver service-centric visibility across hybrid and multicloud environments. It unifies telemetry collection, topology mapping, and machine-learning-driven analytics in a modular architecture designed for workflow automation and integration across diverse infrastructure and applications.
AI engineering is its strongest use case, applying machine learning to operational data for automated analysis and decision support. Cost optimization is a key area for improvement, with more limited capabilities for managing data efficiency and spend. This matters for organizations balancing automation with financial control in complex environments.
ScienceLogic suits organizations embedding machine learning in operations needing scalable data pipelines, model-driven insights, and automated decision support. It fits enterprises advancing data-driven operations across hybrid estates and integrating analytics into workflows, prioritizing automation maturity over deep cost controls.
SolarWinds
See verified user reviews and ratings for SolarWinds on Peer Insights.
SolarWinds Observability offers both SaaS and self-hosted editions, providing unified visibility for hybrid-IT environments. The suite leverages SolarWinds AI for natural language queries and automated summaries, while PerfStack enables correlation and anomaly detection across legacy and cloud systems. SolarWinds Observability also features extensive integrations with third-party tools, customizable dashboards, and advanced alerting capabilities to ensure proactive management of complex infrastructures. Its AI by Design approach aims to break down operational silos and streamline incident resolution.
SolarWinds performs strongest in the AI engineering and business insights use cases. Cost optimization is its lowest-scoring use case, making it the primary area for improvement.
SolarWinds performs strongest in the AI engineering and business insights use cases. Cost optimization is its lowest-scoring use case, making it the primary area for improvement.
SolarWinds is best-suited for organizations prioritizing AI-driven operational analytics, and hybrid-IT management across both legacy and cloud environments.
Splunk
Splunk’s observability is delivered through Splunk Observability Cloud, offering infrastructure monitoring, APM, and DEM across cloud, on-premises, and hybrid environments. The platform uses OTel-based instrumentation to ingest and correlate telemetry from diverse systems. Log data is integrated via Splunk Enterprise or Splunk Cloud Platform for contextual analysis.
Splunk’s highest-scoring use cases are cost optimization and IT operations, linking observability usage with operational behavior and spending drivers to control telemetry consumption and find inefficiencies. The business insights use case currently has the most opportunity for enhancement, with the score reflecting areas where the breadth and depth of analytics can be further expanded and leveraged.
These characteristics align Splunk with midsize to large enterprises in hybrid or multicloud environments. It best suits organizations needing a vendor-neutral, analytics-driven observability platform that prioritizes cost accountability, centralized insight, and cross-team visibility.
Context
Observability platforms have entered a new era, shaped by the convergence of agentic AI, autonomous operations, and the demand for open, flexible architectures. While these platforms remain essential for managing the growing complexity of distributed, hybrid, and multicloud environments, they now extend well beyond traditional monitoring, embedding generative and agent-based AI, supporting real-time automation, and delivering actionable insights that link IT health directly to business outcomes.
This year’s analysis reflects how organizations are prioritizing not only reliability and performance but also transparency, AI, and cost governance. The adoption of bring-your-own-cloud (BYOC) and open data lake architectures is also increasing, as clients seek to avoid vendor lock-in and retain control over their telemetry. Native support for technologies like OpenTelemetry and schema-on-read pipelines enables greater interoperability and flexibility, empowering teams to route, store, and analyze data based on business value.
With the proliferation of LLM-powered features and AI agents, observability platforms are now tasked with safeguarding against bias, hallucinations, and data privacy risks in production AI workloads. At the same time, the shift to usage-based pricing and petabyte-scale data volumes has made cost optimization and predictability a critical concern. Clients now demand platforms that combine advanced AI-driven capabilities, open and extensible architectures, and robust cost controls.
The focus of this analysis is to help organizations navigate these trends — identifying observability platforms that deliver on ambitions of intelligent automation, foster data ownership, and optimize spend, while supporting the agility and resilience required in today’s cloud- and AI-centric IT landscapes.
Market Definition
Gartner defines observability platforms as products that help organizations understand and optimize the health, performance and behavior of applications, services, infrastructure and AI agents, as well as user experience. They ingest and analyze telemetry such as logs, metrics, events and traces to detect issues that affect end users, enabling early remediation. These platforms are used by IT operations, SRE, platform engineering, developers, security teams and product owners.
Modern businesses rely on critical digital applications and services that directly influence revenue, client satisfaction and brand reputation. Outages, latency and degraded performance harm these outcomes. Observability platforms address this by ingesting, correlating and analyzing telemetry from applications, infrastructure and AI systems to detect anomalies, identify the root cause of issues and quantify user‑experience impact.
These capabilities enable organizations to improve the availability, performance and resilience of digital services. As a result, observability platforms support revenue‑loss avoidance through early detection, faster mean time to resolution and prevention of customer‑impacting failures. They also accelerate development and platform engineering workflows by providing continuous feedback on code changes, deployments and model behavior. This allows teams to deliver new features and AI capabilities faster while maintaining reliability and improving customer experience.
Mandatory Features
At a minimum, observability platforms must:
- Ingest, store and analyze operational telemetry feeds, including, but not limited to, metrics, event, log and trace data, with native support for OpenTelemetry.
- Identify, predict and analyze changes in application, service and infrastructure behavior to determine the causes of outages or performance degradation and quantify their impact on end-user experience.
- Enrich telemetry with contextual information, such as topological dependencies or service mapping.
- Support the modeling or mapping of relationships between monitored services and their role in business transactions.
- Collect telemetry from public cloud providers, such as Amazon Web Services and Microsoft Azure.
- Support interactive exploration and analysis of multiple telemetry types, including traces, metrics and logs, to generate insights into user and application behavior.
- Provide automated discovery and mapping of related infrastructure, network, and application components and services.
Optional Features
- Digital experience monitoring (DEM) capabilities, including real user monitoring (RUM) and synthetic monitoring, to analyze the performance, availability and user experience of applications and services delivered through browsers, mobile apps and APIs.
- Integration with operations, service management and software development technologies, such as IT service management (ITSM), configuration management databases (CMDBs), event and incident response management, orchestration and automation, and DevOps tools.
- Telemetry management capabilities for filtering, routing, sampling and aggregating data pipelines to optimize storage costs and improve signal quality. These capabilities also support data privacy and compliance through automated detection, masking or redaction of personally identifiable information (PII) and other sensitive data.
- Advanced analytics and machine learning provide insights that are not feasible through manual analysis.
- Cost management features that measure and optimize application workload cost, as well as observability platform utilization or spend.
- Business process and activity monitoring reflects user journeys, such as login to check out, funnel analysis to track conversion rates, customer onboarding or loan applications.
- AI observability capabilities to analyze the performance, cost and compliance of large language models and generative AI workloads using metrics, such as hallucination detection, token utilization, response relevance and per-token latency.
- Automation capabilities that initiate changes to application and infrastructure code or configuration to optimize cost, capacity or performance, or remediate failures or degradation.
- Application security capabilities that ingest security telemetry, identify known vulnerabilities in monitored applications and block attempts to exploit them.
- Support for monitoring agentic AI architectures by tracing autonomous workflows and tool interactions, ensuring transparency across components using open standards, such as the Model Context Protocol (MCP).
Product/Service Trends
Observability platforms are products that ingest telemetry (operational data) from a variety of sources, including but not limited to logs, metrics, events, and traces. They are principally used to understand the health, performance, and behavior of applications, services, and infrastructure. Observability platforms enable their users to solve difficult issues in diverse and complex application architectures, whether on-premises, in the cloud, or hybrid.
As a minimum, observability platforms supplement telemetry data with two important contexts. The first is a service or topology map that identifies the various components of the application or systems and their dependencies. The second is a business service or end-user context; rather than focusing solely on the performance of IT, observability platforms do so with an understanding of the impact on a specific business service and/or the experience of the user accessing the service.
Beyond the primary use case of understanding the behavior of complex systems, observability platforms have evolved to collect additional types of data to assist adjacent functions, such as security, FinOps, and business performance. As such, observability platforms are increasingly seen as data lakes and analytics platforms for operational intelligence. This has expanded the potential user groups for these platforms beyond SRE and DevOps teams.
More recently, with advancements in large language models, observability platforms are able to more readily surface actionable insights and make intelligent decisions, guiding users on their operational response or next-step action. Such advances are anticipated to have a substantial impact on traditional SRE and I&O operations teams.
Gartner has established nine critical capabilities in the context of seven use cases that differentiate the most popular tools in this market:
- Ingest, optimize, and store telemetry
- Telemetry management (new for 2026)
- Observability cost control
- Exploration of telemetry
- AI/LLM observability
- Generate actionable insights
- Digital experience and business analysis
- Automated response
- Agentic AI (new for 2026)
Interoperability has been removed as a critical capability this year, with interoperability criteria being moved into other capabilities.
The seven use cases are:
- Site reliability engineering
- IT operations
- Software engineering
- DevOps engineering
- Business insights
- Cost optimization
- AI engineering
Critical Capabilities Definition
Ingest, Optimize, Store Telemetry
Ingest, optimize, and store telemetry refers to an observability platform’s ability to ingest multiple sources of telemetry, including but not limited to metrics, events, logs, and traces.
In addition to using proprietary agents and collectors, engineers are progressively adopting standardized and automated telemetry collection methods such as OpenTelemetry. Furthermore, features like monitoring as code and the ability to manage high-cardinality telemetry throughout its life cycle are essential to stay in control of telemetry complexity, volume, and cost. As observability use cases continue to evolve, platforms need to be capable of ingesting data for use cases that go beyond traditional health and performance monitoring.
Telemetry Management
Telemetry management refers to capabilities for filtering, routing, sampling, and aggregating data pipelines to optimize storage costs and improve signal quality.
These capabilities also support data privacy and compliance through automated detection, masking, or redaction of personally identifiable information (PII) and other sensitive data.
Exploration of Telemetry
Exploration of telemetry provides a skilled platform user with ad hoc access to raw telemetry in a manner that supports iterative, hypothesis-driven, and exploratory analysis and facilitates the discovery and classification of user and workload behavior.
A central tenet of observability is that a system’s behavior can be understood by the data it emits. Observability platforms should provide the capability to explore this data, contextualized with service mapping, business service, and end-user experience. Such exploration provides insights related to, for example, probable cause analysis, user experience, and business service impact.
Observability Cost Control
Observability cost control capabilities are designed to facilitate the understanding, management, and optimization of the cost of observability.
The increasing complexity, velocity, and volume of telemetry ingested, analyzed, and stored by observability platforms create a challenge for controlling, forecasting, and optimizing observability spend. Telemetry life cycle management, cost optimization, cost allocation, telemetry usage analytics, and access controls all provide important mechanisms for teams to ensure they optimize the cost of observability today and remain in control as use cases grow.
Generate Actionable Insights
Advanced analytics, AI, and machine learning are able to deliver guided analysis, surface issues, and provide actionable insights about workload behavior that may be predictive or causal.
While observability is founded on the ability to interrogate data to understand system behavior, the increasing complexity of distributed systems and volume of telemetry collected mean that this is no longer possible through manual endeavor alone. Utilizing advanced analytics capabilities, including AI and ML, is an essential component of observability. This results in generated insights, surfacing of “unknown unknowns,” probable cause determination, accelerated mean time to repair (MTTR), and increased productivity through the automation of processes and remediation.
AI/LLM Observability
LLM observability is the ability to monitor, understand, and analyze the behavior and performance of large language models and their workloads in real time or during their development.
As business-critical application workloads become reliant on LLMs for both customer-facing services and internal processes, so does the need to monitor their performance. LLM observability complements application and infrastructure observability with insights specific to LLMs. These include usage, performance, cost, token utilization, latency, drift, toxicity, and hallucination. This provides IT operations teams, SREs, and AI engineering teams with a better understanding and control of their behavior, performance, and outputs.
This capability also supports the monitoring of agentic AI architectures by tracing agentic workflows and tool interactions, ensuring transparency across components.
This capability also supports the monitoring of agentic AI architectures by tracing agentic workflows and tool interactions, ensuring transparency across components.
Digital Experience & Bus. Analysis
Digital experience and business analysis is the identification and analysis of key business performance indicators, user experience, customer journeys, and user behavior.
Combining end-user experience with back-end application and infrastructure telemetry is a vital component of full end-to-end observability. Observability platforms are able to emulate end-user behavior from multiple locations and device types through synthetic transactions, while real-user monitoring evaluates the experience of both individual users and groups of users.
Observability platforms go beyond system health to provide insights into the performance of key business services, transactions, and objectives. Techniques such as funnel analysis and customer journey mapping provide basic insights into customer behavior, abandonment, conversions, and even the financial value of transactions and/or provide context to business-focused tools used in sales, marketing, and operations.
Automated Response
Automated response is the ability of the platform to react to configured, ingested, or detected events by triggering actions, including remediation using internal or external automation frameworks.
Automated process and remediation capabilities reduce time to resolution while improving quality and productivity. For example, software developers can automate the rollback of new features following anomaly detection via integration with DevOps toolchains. Attempts to exploit a known vulnerability can be automatically blocked or infrastructure changes can be made via third-party orchestration or infrastructure-as-code platforms.
Agentic AI
The agentic AI capability is the ability of the observability platform to deploy, monitor, and manage autonomous AI agents that can reason, act, and adapt based on observed telemetry.
This includes, but is not limited to, support for agents that can autonomously predict and detect issues, recommend or implement solutions, and continuously learn from outcomes to improve system performance, reliability, and efficiency.
Use Cases
Site Reliability Engineering
Site reliability engineering is support for improving reliability and resilience for products that need to deliver customer value at speed and at scale while managing risk.
Site reliability engineers work with the product owner to understand operational requirements and define service-level objectives. Site reliability engineers work with product or platform teams to design and continuously optimize systems that meet defined SLOs. SREs are the traditional target audience of application performance monitoring and observability tools.
These teams must rapidly assess the quality and performance of recent releases of often business-critical applications with an emphasis on expedient diagnosis and remediation. This requires that the observability platform is able to ingest multiple, sometimes unanticipated forms of telemetry from across the application stack, combined with a service map that facilitates fast interrogation of the data to understand application behavior. This should be augmented by AI/ML capabilities that can surface anomalies and contribute to probable root cause identification.
IT Operations
IT operations support the immediate and longitudinal understanding of the health and performance of platforms.
Investment in modern observability platforms is driven by the shift from legacy applications to microservices, containers, and distributed, adaptable infrastructure. These platforms must provide comprehensive visibility across all technology generations, especially the ephemeral, short-lived components. IT operations, responsible for critical system integrity, face new monitoring challenges as they are often detached from the creation or evolution of these systems.
DevOps Engineering
DevOps engineering focuses on automation, CI/CD pipeline health, deployment monitoring, and integration.
The shift from monolithic to agile, automated CI/CD pipelines in DevOps is driving investment in observability. With the adoption of microservices, containers, and infrastructure-as-code, complexity and change velocity increase, necessitating monitoring of both application health and the deployment pipeline. Observability platforms are crucial for offering a performance and experiential perspective on pipeline changes. By integrating telemetry across the CI/CD toolchain and production, these platforms enable early issue detection, reduced MTTR, and sustained high release velocity. Specifically, they provide postdeployment visibility into performance and end-user experience, guiding necessary actions to mitigate impact and ensure service quality.
Software Engineering
Software engineering is engagement in the development, creation, validation, securing, deployment and maintenance of applications.
Software engineering utilizes observability platforms throughout the development and deployment cycle. Buyers in this category value method-level visibility into code behavior and performance, including the ability to compare and profile code in production environments. Crucially, observability platforms surface actionable behavioral data from live systems, enabling teams to identify issues and prioritize development based on actual customer experience and business impact, capabilities that go beyond what synthetic testing alone can offer. Synthetic transactions still play a role by automating functional testing, but observability provides a comprehensive, real-world perspective that developers value.
Cost Optimization
Cost optimization is focused on using telemetry analysis and insights to understand and optimize both workload and observability cost.
While not replacing a dedicated FinOps function, products in this market that excel at this use case provide cost, capacity, and performance optimization capabilities to SREs and platform operations teams. Macroeconomic conditions have led to increased focus on cost and performance in a number of areas. Observability platform users with the responsibility to optimize cost appreciate capabilities related to forecasting and optimization of cloud-hosted workloads, including insightful recommendations for capacity adjustments.
The cost of observability itself is also under scrutiny, with observability platform owners seeking capabilities to gain control of the cost of collecting and analyzing increasing volumes of telemetry.
Business Insights
Business insights are essential to those responsible for managing the delivery of services to end users who are aligned with the business function.
Typically, application owners are interested in nontechnical insights that provide both quantitative and qualitative measures of business service performance and customer journeys. Observability platforms now deliver faster and more accessible business insights, such as sales, revenue, and customer experience, by providing prebuilt business logic templates, automated transaction tracing, and intuitive search capabilities that make it easier to connect technical telemetry with strategic business outcomes. Buyers in this group value real-time business insights provided by a flexible data platform, comprehensive dashboarding capabilities, and an intuitive user experience enhanced by a natural language interface.
AI Engineering
AI engineering is engaging in the delivery of and support for AI and GenAI solutions at scale.
AI engineering enables organizations to establish and grow high-value portfolios of AI solutions consistently and securely. In doing so, they rely on capabilities that enable them to monitor and observe the performance of AI and LLM models both during development and once in production. This includes LLM and AI model drift, bias, and hallucination in production, token usage, and the associated cost of LLM models as well as the comparative performance and cost across models. Just as application tracing enables observability of requests across a complex distributed application, prompt tracing provides similar transparency across increasingly complex and augmented prompts.
Vendors Added and Dropped
We review and adjust our inclusion criteria for Critical Capabilities as markets change. As a result of these adjustments, the mix of vendors in any Critical Capability may change over time. A vendor’s appearance in a Critical Capability one year and not the next does not necessarily indicate that we have changed our opinion of that vendor. It may be a reflection of a change in the market and, therefore, changed inclusion criteria, or of a change of focus by that vendor.
Added
- Alibaba Cloud
- HPE
Dropped
- ITRS
- Oracle
- Sumo Logic
Inclusion Criteria
The inclusion criteria are the specific attributes that a provider must have to be included in this Critical Capabilities. To qualify for inclusion, providers need to satisfy the following criteria:
Market Participation Inclusion Criteria
- Provide generally available capabilities as of 17 March 2026. General availability means the product or service is available to all customers for purchase through normal sales channels.
- Actively market, sell, and support a product that provides capabilities as defined in the market definition for observability platforms. Be recognized by the observability platform market, as evidenced by regular appearances on client shortlists, promoting observability platforms by appearances at industry events, and by references as a competitor by other vendors.
- Sell the observability platform solution directly to paying customers without requiring them to engage professional services help. The vendor must provide at least first-line support for these capabilities, including any bundled open-source software. This includes but is not limited to comprehensive product documentation, installation guidance, and reference examples.
- Demonstrate an active product roadmap, go-to-market, and selling strategy for their solutions.
- Have phone, email, and/or web customer support. They must offer contract, console/portal, technical documentation, and customer support in English (either as the product’s default language or as an optional localization).
Performance Threshold Achievement
- The observability platform offering must have at least 50 paying, production (non-beta-test) customers in at least each of two or more geographic regions (APAC, EMEA, LATAM or North America) excluding sales to MSPs.
- The observability platform offering must have generated at least $75 million in annual generally accepted accounting principles (GAAP) revenue during the 12 calendar months prior to its receipt of Gartner’s Critical Capabilities welcome packet.
Or:
- The observability platform offering must have generated a minimum of $10 million in annual revenue, combined with a growth rate of at least 25% in the 12 calendar months prior to the receipt of the welcome packet, compared to its previously completed 12-month period.
Revenue figures must be reported in USD constant currency.
Weighting for Critical Capabilities in Use Cases
| Critical Capabilities | Site Reliability Engineering | IT Operations | DevOps Engineering | Cost Optimization | Software Engineering | AI Engineering | Business Insights |
|---|---|---|---|---|---|---|---|
Ingest, Optimize, Store Telemetry | 10% | 25% | 10% | 5% | 15% | 5% | 5% |
Telemetry Management | 15% | 20% | 15% | 20% | 15% | 10% | 5% |
Observability Cost Control | 5% | 10% | 10% | 60% | 5% | 5% | 5% |
Exploration of Telemetry | 20% | 15% | 15% | 5% | 30% | 15% | 10% |
Generate Actionable Insights | 15% | 20% | 20% | 5% | 20% | 10% | 15% |
AI/LLM Observability | 5% | 0% | 5% | 0% | 5% | 40% | 10% |
Digital Experience & Bus. Analysis | 10% | 5% | 5% | 0% | 5% | 5% | 50% |
Automated Response | 15% | 5% | 20% | 5% | 5% | 5% | 0% |
Agentic AI | 5% | 0% | 0% | 0% | 0% | 5% | 0% |
As of 7 July 2026 | |||||||
Source: Gartner (July 2026)
This methodology requires analysts to identify the critical capabilities for a class of products/services. Each capability is then weighted in terms of its relative importance for specific product/service use cases.
Critical Capabilities Rating
Each of the products/services that meet our inclusion criteria has been evaluated on the critical capabilities on a scale from 1.0 to 5.0.
Product/Service Rating on Critical Capabilities
| Critical Capabilities | Alibaba Cloud | Amazon Web Services | Apica | BMC Helix | Chronosphere | Coralogix | Datadog | Dynatrace | Elastic | Grafana Labs | Honeycomb | HPE | IBM | LogicMonitor | Microsoft | New Relic | ScienceLogic | SolarWinds | Splunk |
|---|---|---|---|---|---|---|---|---|---|---|---|---|---|---|---|---|---|---|---|
Ingest, Optimize, Store Telemetry | 3.8 | 3.7 | 3.4 | 3.5 | 3.7 | 3.8 | 3.8 | 4.3 | 4.1 | 3.8 | 3.8 | 3.6 | 3.7 | 3.2 | 3.4 | 4.0 | 2.2 | 3.6 | 3.8 |
Telemetry Management | 3.2 | 2.9 | 3.2 | 3.1 | 3.3 | 3.4 | 3.7 | 3.5 | 3.5 | 3.4 | 3.4 | 2.1 | 3.0 | 3.0 | 3.3 | 3.3 | 2.4 | 1.9 | 3.1 |
Observability Cost Control | 2.6 | 3.3 | 2.3 | 3.1 | 4.2 | 4.0 | 3.7 | 3.5 | 3.7 | 4.0 | 3.6 | 2.6 | 3.3 | 3.2 | 3.5 | 3.8 | 2.1 | 2.1 | 3.9 |
Exploration of Telemetry | 3.5 | 3.7 | 2.9 | 3.4 | 3.9 | 3.4 | 3.8 | 3.4 | 3.6 | 3.6 | 3.3 | 2.5 | 3.9 | 2.8 | 3.5 | 3.3 | 3.4 | 2.8 | 3.3 |
Generate Actionable Insights | 3.5 | 3.6 | 3.0 | 3.6 | 3.7 | 3.8 | 3.9 | 3.8 | 4.1 | 3.7 | 3.6 | 1.7 | 3.8 | 3.6 | 3.5 | 4.0 | 3.5 | 2.2 | 3.5 |
AI/LLM Observability | 3.5 | 4.0 | 2.0 | 4.1 | 4.2 | 4.1 | 4.4 | 4.5 | 4.1 | 4.4 | 3.9 | 2.2 | 4.0 | 3.8 | 4.1 | 4.3 | 3.3 | 3.3 | 3.5 |
Digital Experience & Bus. Analysis | 3.1 | 2.1 | 2.7 | 3.0 | 3.1 | 3.5 | 3.5 | 3.6 | 3.6 | 3.3 | 3.5 | 1.5 | 3.2 | 3.0 | 3.3 | 3.9 | 3.1 | 2.7 | 3.3 |
Automated Response | 3.6 | 2.6 | 3.0 | 3.4 | 2.6 | 3.2 | 3.2 | 3.2 | 3.3 | 3.3 | 3.0 | 2.3 | 2.8 | 3.6 | 2.8 | 3.1 | 3.1 | 2.8 | 3.1 |
Agentic AI | 3.7 | 2.8 | 2.2 | 3.4 | 3.2 | 3.5 | 3.6 | 3.6 | 3.3 | 3.4 | 3.3 | 1.8 | 3.2 | 3.4 | 3.3 | 3.4 | 3.0 | 1.7 | 2.9 |
As of 7 July 2026 | |||||||||||||||||||
Source: Gartner (July 2026)
Table 3 shows the product/service scores for each use case. The scores, which are generated by multiplying the use-case weightings by the product/service ratings, summarize how well the critical capabilities are met for each use case.
Product Score in Use Cases
| Use Cases | Alibaba Cloud | Amazon Web Services | Apica | BMC Helix | Chronosphere | Coralogix | Datadog | Dynatrace | Elastic | Grafana Labs | Honeycomb | HPE | IBM | LogicMonitor | Microsoft | New Relic | ScienceLogic | SolarWinds | Splunk |
|---|---|---|---|---|---|---|---|---|---|---|---|---|---|---|---|---|---|---|---|
Site Reliability Engineering | 3.40 | 3.19 | 2.91 | 3.37 | 3.47 | 3.57 | 3.68 | 3.62 | 3.67 | 3.58 | 3.41 | 2.24 | 3.43 | 3.21 | 3.34 | 3.59 | 2.99 | 2.57 | 3.33 |
IT Operations | 3.37 | 3.34 | 3.05 | 3.34 | 3.59 | 3.66 | 3.73 | 3.72 | 3.79 | 3.63 | 3.51 | 2.45 | 3.47 | 3.16 | 3.37 | 3.69 | 2.76 | 2.61 | 3.47 |
DevOps Engineering | 3.37 | 3.23 | 2.93 | 3.37 | 3.47 | 3.60 | 3.67 | 3.61 | 3.70 | 3.61 | 3.42 | 2.28 | 3.40 | 3.26 | 3.33 | 3.60 | 2.94 | 2.57 | 3.39 |
Cost Optimization | 2.90 | 3.21 | 2.61 | 3.15 | 3.84 | 3.77 | 3.66 | 3.51 | 3.68 | 3.79 | 3.52 | 2.44 | 3.25 | 3.14 | 3.38 | 3.64 | 2.33 | 2.20 | 3.65 |
Software Engineering | 3.41 | 3.41 | 2.97 | 3.40 | 3.65 | 3.63 | 3.77 | 3.68 | 3.78 | 3.64 | 3.47 | 2.35 | 3.59 | 3.15 | 3.42 | 3.65 | 2.99 | 2.64 | 3.41 |
AI Engineering | 3.42 | 3.53 | 2.54 | 3.62 | 3.80 | 3.77 | 3.98 | 3.96 | 3.85 | 3.91 | 3.60 | 2.22 | 3.68 | 3.40 | 3.66 | 3.85 | 3.11 | 2.77 | 3.41 |
Business Insights | 3.25 | 2.83 | 2.73 | 3.27 | 3.47 | 3.63 | 3.72 | 3.70 | 3.73 | 3.57 | 3.54 | 1.90 | 3.44 | 3.15 | 3.44 | 3.87 | 3.10 | 2.65 | 3.39 |
As of 7 July 2026 | |||||||||||||||||||
Source: Gartner (July 2026)
To determine an overall score for each product/service in the use cases, multiply the ratings in Table 2 by the weightings shown in Table 1.
Critical Capabilities Methodology
This methodology requires analysts to identify the critical capabilities for a class of products or services. Each capability is then weighted in terms of its relative importance for specific product or service use cases. Next, products/services are rated in terms of how well they achieve each of the critical capabilities. A score that summarizes how well they meet the critical capabilities for each use case is then calculated for each product/service.
"Critical capabilities" are attributes that differentiate products/services in a class in terms of their quality and performance. Gartner recommends that users consider the set of critical capabilities as some of the most important criteria for acquisition decisions.
In defining the product/service category for evaluation, the analyst first identifies the leading uses for the products/services in this market. What needs are end-users looking to fulfill, when considering products/services in this market? Use cases should match common client deployment scenarios. These distinct client scenarios define the Use Cases.
The analyst then identifies the critical capabilities. These capabilities are generalized groups of features commonly required by this class of products/services. Each capability is assigned a level of importance in fulfilling that particular need; some sets of features are more important than others, depending on the use case being evaluated.
Each vendor’s product or service is evaluated in terms of how well it delivers each capability, on a five-point scale. These ratings are displayed side-by-side for all vendors, allowing easy comparisons between the different sets of features.
Ratings and summary scores range from 1.0 to 5.0:
1 = Poor or Absent: most or all defined requirements for a capability are not achieved
2 = Fair: some requirements are not achieved
3 = Good: meets requirements
4 = Excellent: meets or exceeds some requirements
5 = Outstanding: significantly exceeds requirements
To determine an overall score for each product in the use cases, the product ratings are multiplied by the weightings to come up with the product score in use cases.
The critical capabilities Gartner has selected do not represent all capabilities for any product; therefore, may not represent those most important for a specific use situation or business objective. Clients should use a critical capabilities analysis as one of several sources of input about a product before making a product/service decision.