Manage Technology Decision Risk, Complexity and Value Realization
12 February 2026 - ID G00846463 - 11 min read
By Auria Asadsangabi, Lucas Kobat, and 1 more
Rapid digital transformation has increased both the volume and speed of architecturally significant decisions. Heads of enterprise architecture must assess and communicate the trade-offs for these decisions to better align technology investments with business outcomes.
Insights at a Glance
As organizations expand their digital ambitions, technology choices have become more complex and consequential. When distributed business and technology teams make these decisions independently, the result is often limited by a narrow perspective that misses the holistic view.
Heads of enterprise architecture (EA) can counter the fragmentation fueled by democratized technology with three high-impact practices:
- Quantify and communicate trade-offs for stakeholders to understand the broader implications of their choices.
- Present guidance as clear, evidence-based options, empowering informed decision making across the organization.
- Use integrated roadmaps to proactively identify interdependencies, manage risk, and ensure technology investments support long-term business priorities.
Impact Brief
The pace of technology adoption is accelerating, but so is the complexity of getting those decisions right. This acceleration often breeds a messy IT estate characterized by redundant systems, growing costs and hidden technical debt.
For the head of EA, the challenge is no longer just about technical specification; it is about preventing a fragmented landscape where high-stakes investments fail to deliver and organizational agility is sacrificed for short-term speed. Compounding this is the shift toward distributed authority, where business leaders make independent technology choices that often bypass traditional oversight.
To maintain alignment without becoming a bottleneck, heads of EA must evolve into strategic advisors who can clearly articulate the complex trade-offs of these decisions to stakeholders. By adopting a structured approach that prioritizes proactive partnership and long-term roadmap continuity, they can transform architectural complexity into a streamlined, high-value engine for the enterprise.
Actions
To ensure technology choices drive strategic business outcomes rather than just adding complexity, heads of EA should focus on these three high-impact practices:
- Establish clear trade-off points — ranging from ROI to cybersecurity risk. This helps stakeholders understand how a localized decision ripples across the enterprise, enabling a more holistic view.
- Use visual tools like radar charts to compare trade-offs against each other, making impacts impossible to ignore.
- Integrate every major technology choice into the broader enterprise roadmap to proactively manage technical debt and eliminate redundancies.
Manage Technology Decision Risk, Complexity and Value Realization
Define Trade-Off Points to Assess Architecture Decisions
Technology investment decisions often lack the essential trade-off analysis needed to substantiate their business case. Business and IT stakeholders often are not aware of the far-reaching impacts of their technology decisions. In fact, these stakeholders typically focus only on the trade-offs pertinent to their business units or functional areas.
Heads of EA must define and assess the trade-off points for architecturally significant technology decisions so that they can better inform stakeholders of impacts they might have missed. Table 1 represents critical dimensions to consider when evaluating architectural decisions and their potential impacts.
Key Trade-Off Points to Assess Architecture Decisions
| Trade-off points | Why they are important | Whom to partner with |
|---|---|---|
Return on investment (ROI) | ROI quantifies and compares the expected financial and operational payback of competing architectural approaches (for example, microservices vs. monolith). | The finance department — specifically financial analysts — can develop robust cost-benefit analyses that encompass the full range of potential investments. |
Net present value (NPV) | NPV brings a long-horizon perspective to architecture choices by discounting future benefits (faster releases and lower maintenance) and costs (migration and licensing) back to today’s budget. | The finance department — specifically investment analysts — can carefully analyze the anticipated cash inflows and outflows generated by each initiative. |
Total cost of ownership (TCO) | The TCO captures the full life cycle cost of a technology investment: initial design, provisioning, ongoing support, skills development, technology debt remediation and eventual decommissioning. | The IT department — specifically technology procurement specialists — can accurately assess initial costs, ongoing maintenance expenses and the estimated life span of the technology being considered. |
Competitive advantage | Competitive advantage evaluates how a technology investment enables unique capabilities (for example, real-time personalization or subsecond response at scale) that your competitors can’t match. | The sales and marketing department — specifically business development managers — can analyze market trends, understand competitors and identify the unique value proposition of each proposed initiative. |
Business impact | Business impact links architecture decisions to concrete KPIs — throughput, uptime SLAs, compliance metrics and customer churn. | The operations department — specifically operations managers — can analyze each initiative’s expected impact to evaluate key performance metrics. |
Strategic fit | Strategic fit assesses how well an architectural direction (for example, an event-driven, API-first, cloud-native architecture) aligns with your long-term strategic roadmap (digital transformation goals, merger targets or regulatory shifts). | The strategy department — specifically corporate strategists — play a key role in analyzing how each initiative aligns with the organization’s strategic goals, often utilizing techniques like business capability modeling for project-centric approaches or value stream mapping and customer journey mapping for product-centric delivery. |
Productivity gain | Productivity gain measures the boost in developer and operator efficiency enabled by an architecture’s modularity, automation, standardization and tooling (for example, self-service platforms). | The HR department — specifically HR managers — can evaluate initial change management costs and the potential for ongoing human augmentation and improved employee experience stemming from the initiatives. |
Customer experience | Customer experience examines how architectural choices (caching layers, edge services and fault tolerance patterns) directly impact end-user metrics, such as latency, availability and personalization. | The customer service department — specifically customer success managers — can analyze how each initiative will affect customer journeys and satisfaction metrics, ensuring a positive customer experience. |
Innovation potential | Innovation potential gauges an architecture’s ability to absorb or enable emerging technologies (e.g., AI agents). | The IT department — specifically innovation leaders — can analyze the potential of each initiative to optimize or transform existing business capabilities through innovative technologies and approaches. |
Implementation risk | Implementation risk identifies the architectural complexity, team skills gaps and integration challenges that could derail rollout (for example, migrating to a service mesh or refactoring for event sourcing). | Project managers within the PMO can proactively identify and mitigate potential problems during the implementation process. |
Operational risk | Operational risk looks at how an architecture affects runtime resilience, monitoring coverage and recoverability (for example, single points of failure and observability gaps). | Operations and risk management teams can identify potential threats to internal processes, people and systems. |
Cybersecurity risk | Cybersecurity risk examines inherent security properties of each architectural style (zero-trust boundaries, encryption in transit and identity federation). | The cybersecurity team can assess vulnerabilities and ensure robust security measures are in place to protect the organization’s digital assets. |
Source: Gartner (February 2026)
Confidently assessing these trade-off points often requires input from outside the EA function’s area of expertise. Heads of EA need to partner with peer leaders across the enterprise to have their teams coassemble the necessary data and insights. Consulting authoritative sources and co-creating analysis with stakeholders enhance the credibility and influence of EA recommendations against architecturally significant technology decisions.
Partner With Business and IT Stakeholders to Ensure Informed Trade-Offs Are Made
Heads of EA want to be involved in the decision-making process of architecturally significant changes, not to own the changes, but to inform them. Partner with senior business and IT stakeholders to guide the most architecturally significant decisions. This involves framing recommendations strategically, visualizing trade-offs clearly and guiding decisions toward desired enterprise outcomes.
Frame Architecture Recommendations as Choices
Heads of EA should move beyond strict technical mandates and present guidance as alternative choices cast explicitly in business terms. This fosters a productive dialogue, helps stakeholders articulate priorities and allows for tailored guidance based on audience-relevant business outcomes.
The strategic choice process starts with defining the business problem or opportunity with stakeholders and results in recommending the optimal approach based on a comprehensive evaluation (see Figure 1).
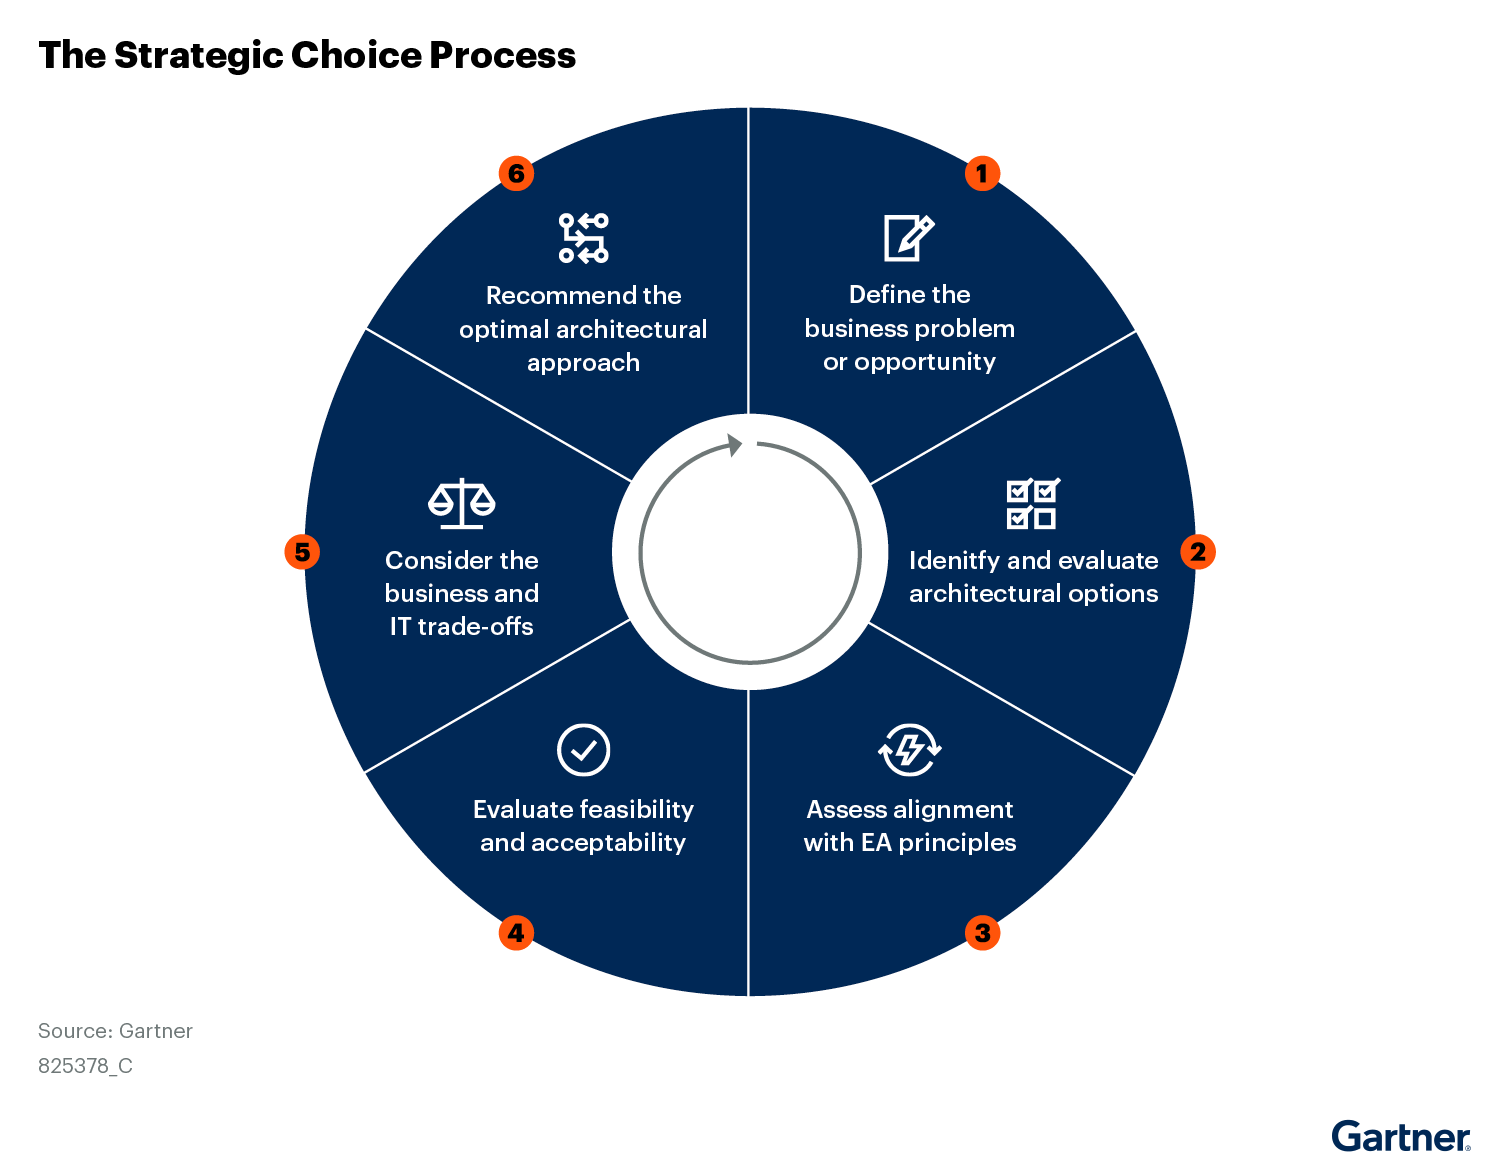
For example, instead of issuing a technical imperative, heads of EA can frame an upgrade as two options to enhance a business capability (for example, order fulfillment), detailing potential benefits and risks in business terms (for example, initial cost, disruption, scalability, agility, technical debt, security and ROI). Framing choices in this way demonstrates the head of EA’s ability to connect technology to business objectives, improves credibility, and increases the likelihood of earlier involvement and influence.
Visualize the Trade-Offs of Proposed Choices
Clearly visualizing the business and technology implications of architectural alternatives is crucial for gaining stakeholder understanding and ensuring decisions drive positive performance. Visualizations should be tailored to each audience segment, presenting information in a way that resonates with their specific concerns and priorities:
- For the CIO (and for the CIO to use with CxO peers): Visualizations should focus on high-level implications for the overall strategy, financial performance, operational efficiency, and cost and risk mitigation.
- For IT leadership: Visualizations should illustrate technical aspects like scalability, security, maintainability, compliance, resource optimization and technical risk.
- For business unit leaders: Visualizations should demonstrate impacts on specific functions, value streams, operational processes, customer experiences and revenue growth.
The radar chart, also known as a spider diagram, is a simple yet powerful visualization tool used to present multiple metrics in a single view. Similar metrics are often placed next to each other in the visualization to facilitate grouping and description. In the context of architecture trade-off analysis, these charts can have separate axes representing different dimensions and metrics, such as financial metrics (ROI, NPV and TCO), which can be collectively referred to as the “financial dimension.” Other dimensions and their underlying metrics and associated risks should also be included (see Figure 2).
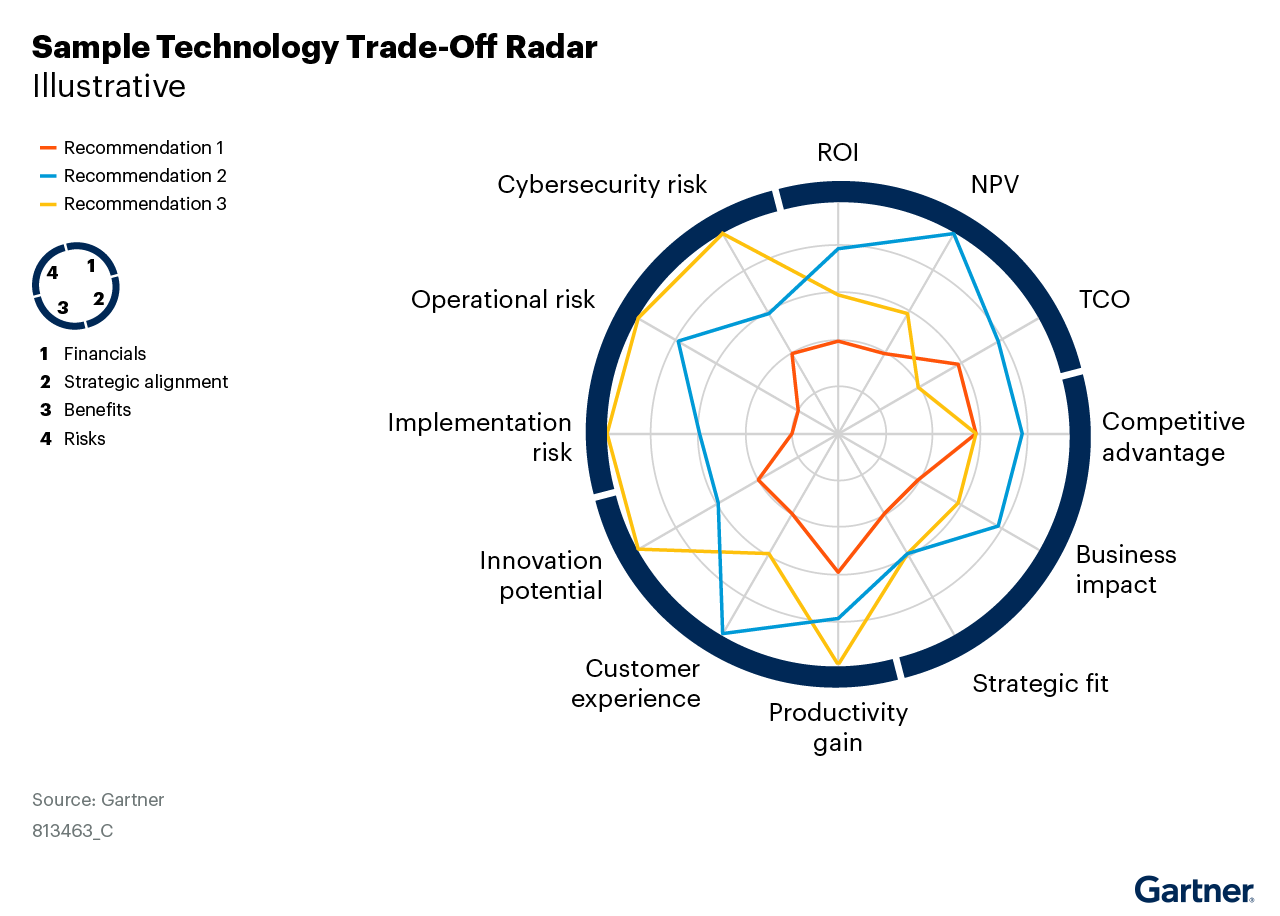
The importance of radar charts, particularly in the domain of enterprisewide technology investment decisions, stems from their ability to instantaneously offer a comparative picture of trade-offs for business and IT leaders. By visually presenting multiple metrics simultaneously, radar charts both inform and accelerate decision making, based on projected impacts of the respective decisions. A clear visual presentation of alternative recommendations and their implications facilitates stakeholder understanding via direct comparison.
Use Roadmaps to Manage Trade-Offs at Scale
While understanding and communicating trade-offs for a single technology decision is crucial, heads of EA must acknowledge that individual decisions do not occur in isolation. One technology decision invariably impacts another, leading to new interdependencies and downstream consequences.
Therefore, heads of EA need to operate at scale, monitoring all architecturally significant technology decisions at once, not just each of these decisions individually. This requires an advanced approach to roadmapping, which connects strategic goals to actions, improves visibility and ensures resource alignment.
Organizations often struggle with synchronizing plans and managing interdependencies due to varied roadmapping approaches used across the enterprise. To manage the ongoing impact of scaling architecturally significant decisions, heads of EA should focus on best practices in maintaining roadmap traceability and enabling their discovery and usage.
Maintain Roadmap Traceability
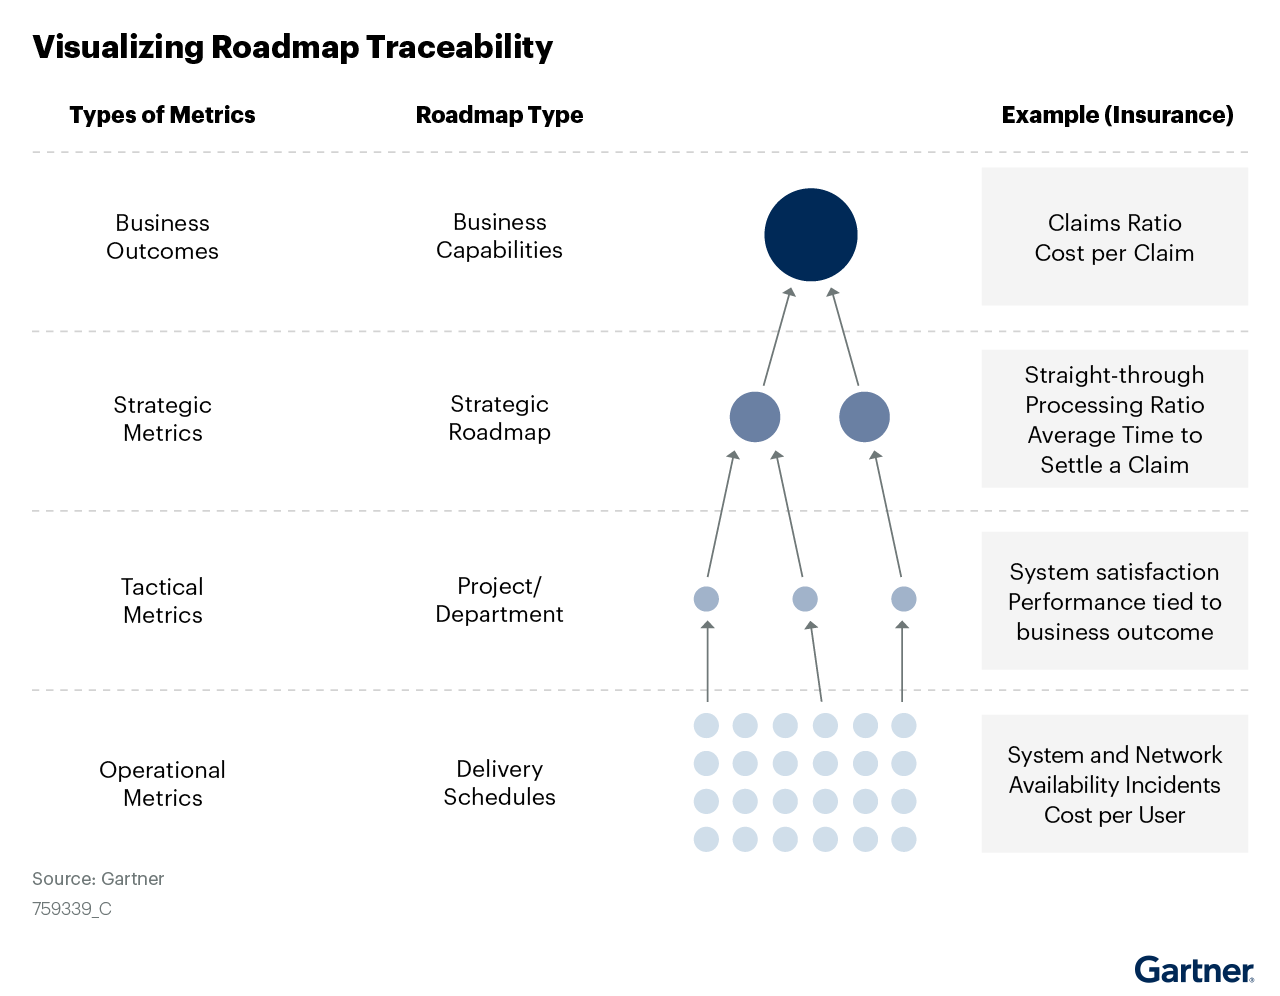
Traceability is important across all levels of roadmaps, as they serve as a logical assemblage of strategic plans. This means:
- Delivery schedules link to projects and departments
- Project roadmaps track back to the IT strategic roadmap
- IT strategic roadmaps map back to enhanced business capabilities
- Business capability roadmaps express the overall business strategy
This cascading linkage ensures traceability from strategy through to execution. Heads of EA are personally responsible for being able to demonstrate this traceability so they can confidently speak to the impact of architecture changes. Therefore, heads of EA must dedicate time from their teams to ensure this traceability is maintained (see Figure 3).
Enable Discovery and Usage of Roadmaps
Roadmaps are evolutionary and must be continually reshaped to reflect current portfolio realities and adjust to outlined goals. To monitor all ongoing initiatives and adapt roadmaps based on new technology decisions or changes, heads of EA must ensure roadmaps are easily discoverable, accessible and governed.
Table 2 provides five immediate actions heads of EA can direct their teams to take to enable the discovery and usage of roadmaps.
Methods to Enable Roadmap Discovery and Usage
| Method | Description |
|---|---|
Enhancing collaboration | Roadmaps, alongside their associated templates and documentation, should be placed in standard, easily discoverable locations, such as dedicated project spaces, centralized architecture sites, or within EA or PMO tools, to leverage collaboration capabilities available within these platforms. |
Universal accessibility | Stakeholders should have correct licenses to view roadmaps or publish them in universally accessible formats like PDF. |
Metadata tagging | Heads of EA can assist traceability by tagging related, dependent or connected roadmaps with similar metadata. |
Community of practice | Heads of EA should establish a community for sharing best practices and embed roadmap templates within project kickoff packages. |
Feedback mechanisms | Feedback enables viewers or users to flag potential issues, inaccuracies or inconsistencies (for example, through comments or contact information). This transforms roadmaps into living documents that stay current with the shifting organizational landscape. |
Source: Gartner (February 2026)
By effectively managing the visibility and evolution of roadmaps, heads of EA can ensure that individual architecturally significant decisions are integrated into the broader enterprise technology roadmap, allowing for proactive adjustments to interdependencies and continued alignment with strategic objectives.
Success Measures
Heads of EA can use the following sample list of metrics to measure success:
- Percentage of delivery teams that adopt EA recommendations.
- Percentage of current projects whose technical designs fit within the IT strategic roadmap.
- EA satisfaction index according to business partners or product owners.
- Percentage of strategic initiatives EA is involved in.