Voice of the Customer for Augmented Data Quality Solutions
27 July 2026 - ID G00858553 - 3 min read
By Peer Community Contributor
Rising adoption of ADQ solutions is driven by the need to overcome data quality barriers, accelerate AI success and ensure trusted, reliable data for business impact. This note guides data and analytics leaders to learn from ratings and reviews shared by their peers on Gartner Peer Insights.
Voice of the Customer
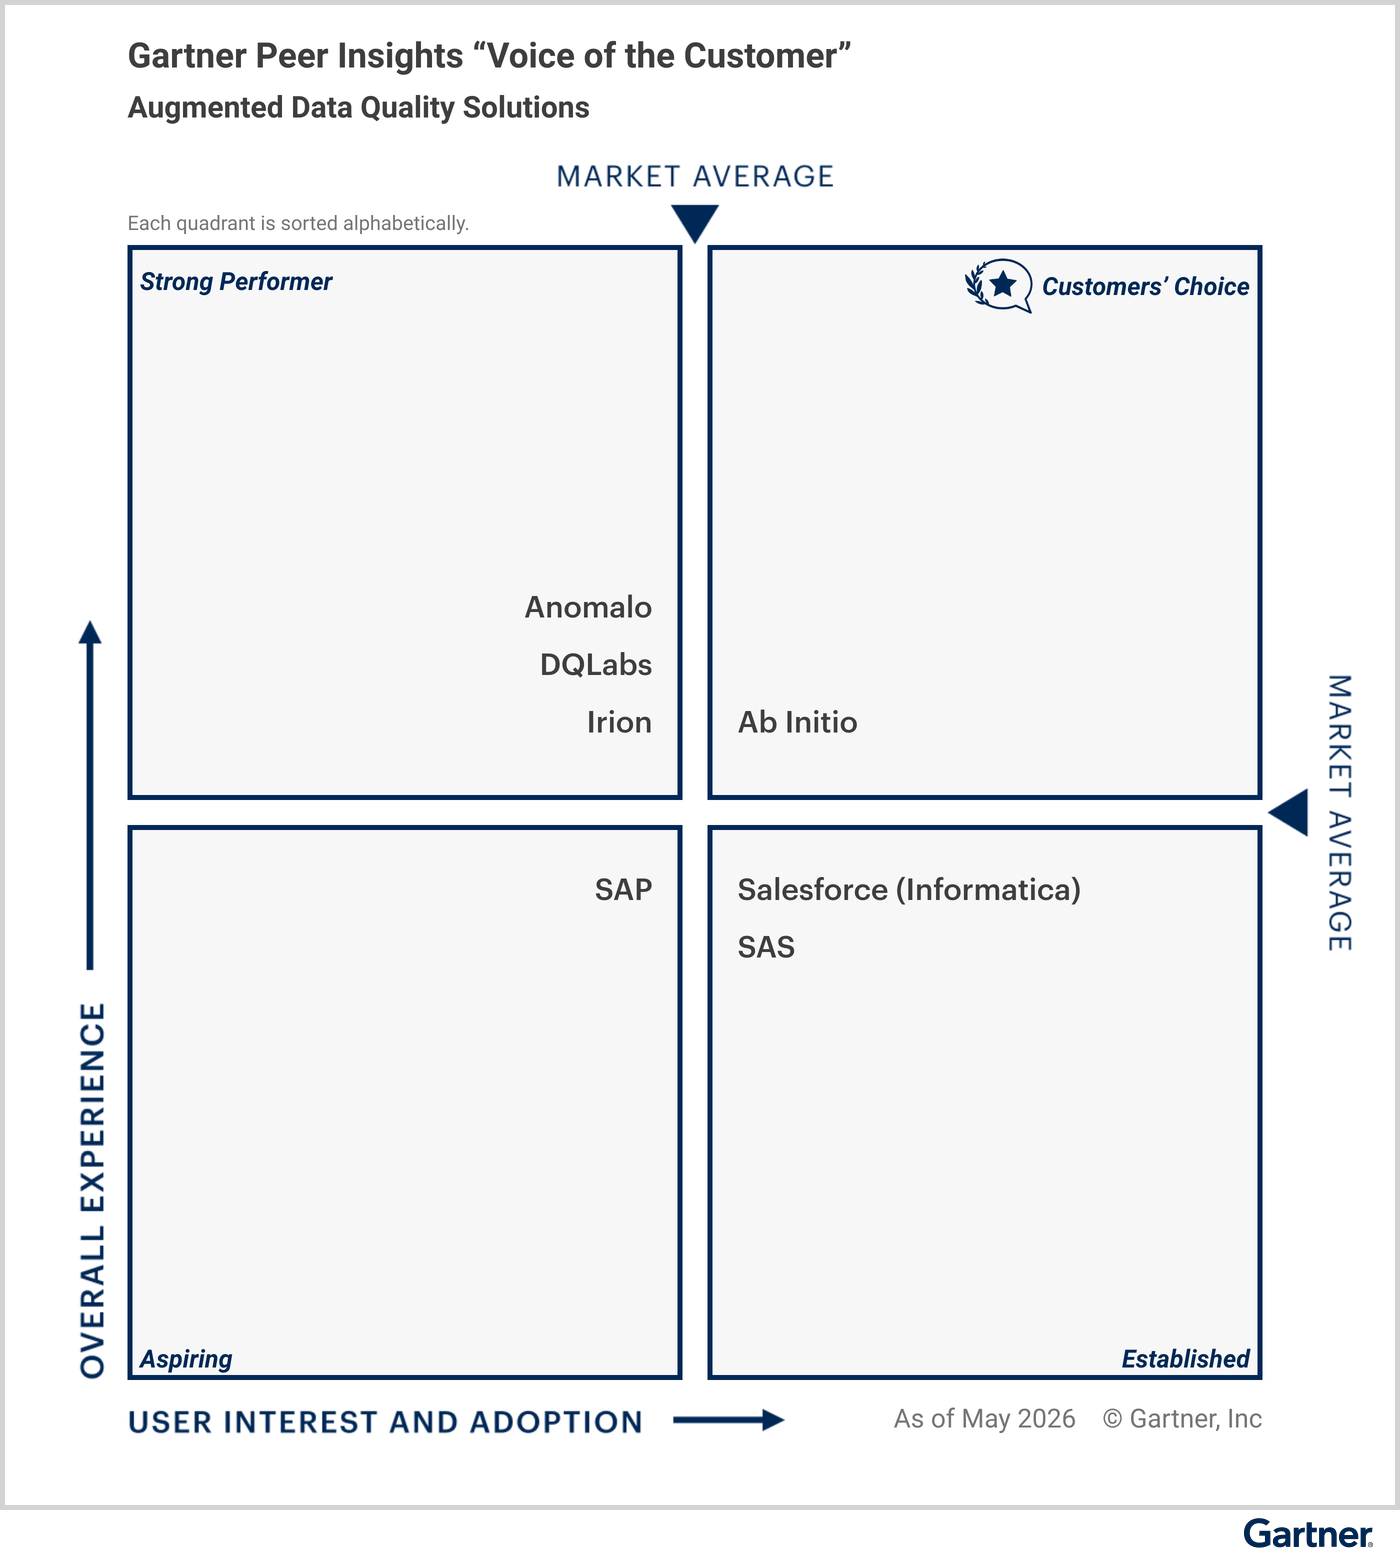
Gartner Peer Insights Voice of the Customer evaluates vendors in a given technology market by applying a specific methodology to aggregated end-user reviews. Vendors are then positioned into four quadrants based on two criteria: User Interest and Adoption (x-axis), and Overall Experience (y-axis) (see Figure 1). See the Methodology section for details.
Along with the historical peer-based perspective represented in this document, Gartner has a related expert-led Magic Quadrant for Augmented Data Quality Solutions.
Peers’ Willingness to Recommend
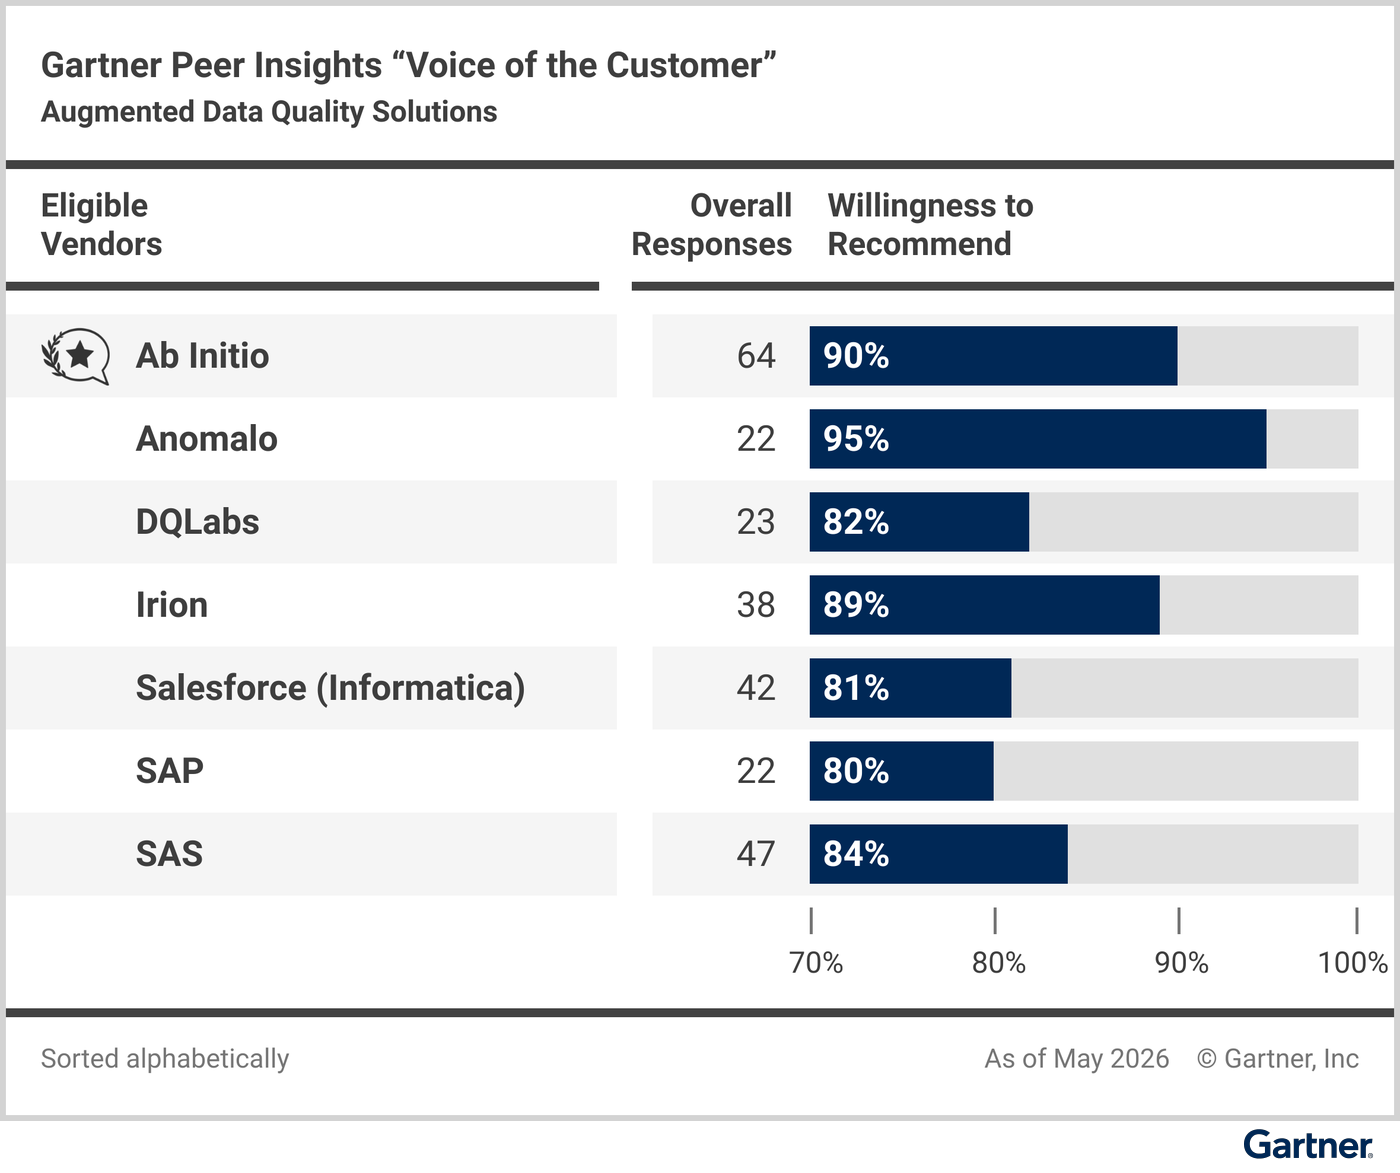
Gartner Peer Insights reviewers rate their willingness to recommend each vendor. Figure 2 compares vendors according to the reviewers’ willingness to recommend them.
Vendors’ End-User Rating Summaries
Figures 3 through 9 summarize key information for each vendor included in the “Voice of the Customer”:
- Overall Rating and rating distribution
- Other ratings covering specific aspects of the experience with the vendor
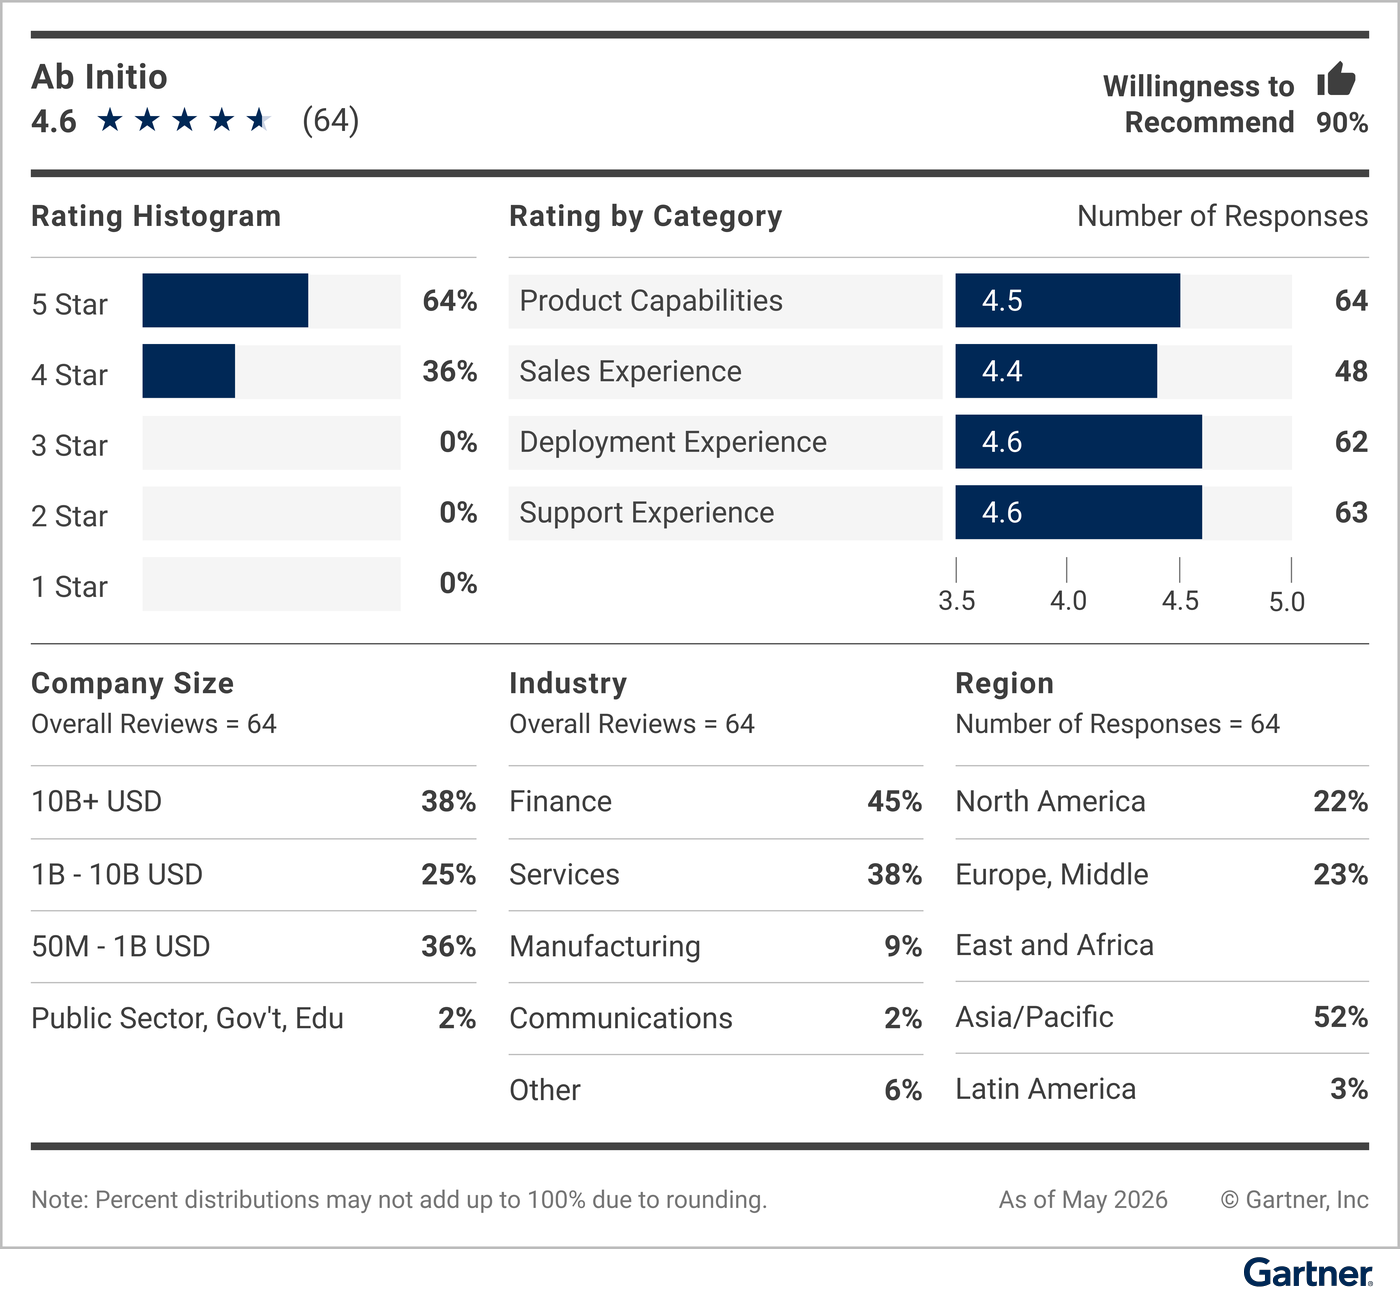
Read all Peer Insights user reviews for Ab Initio.
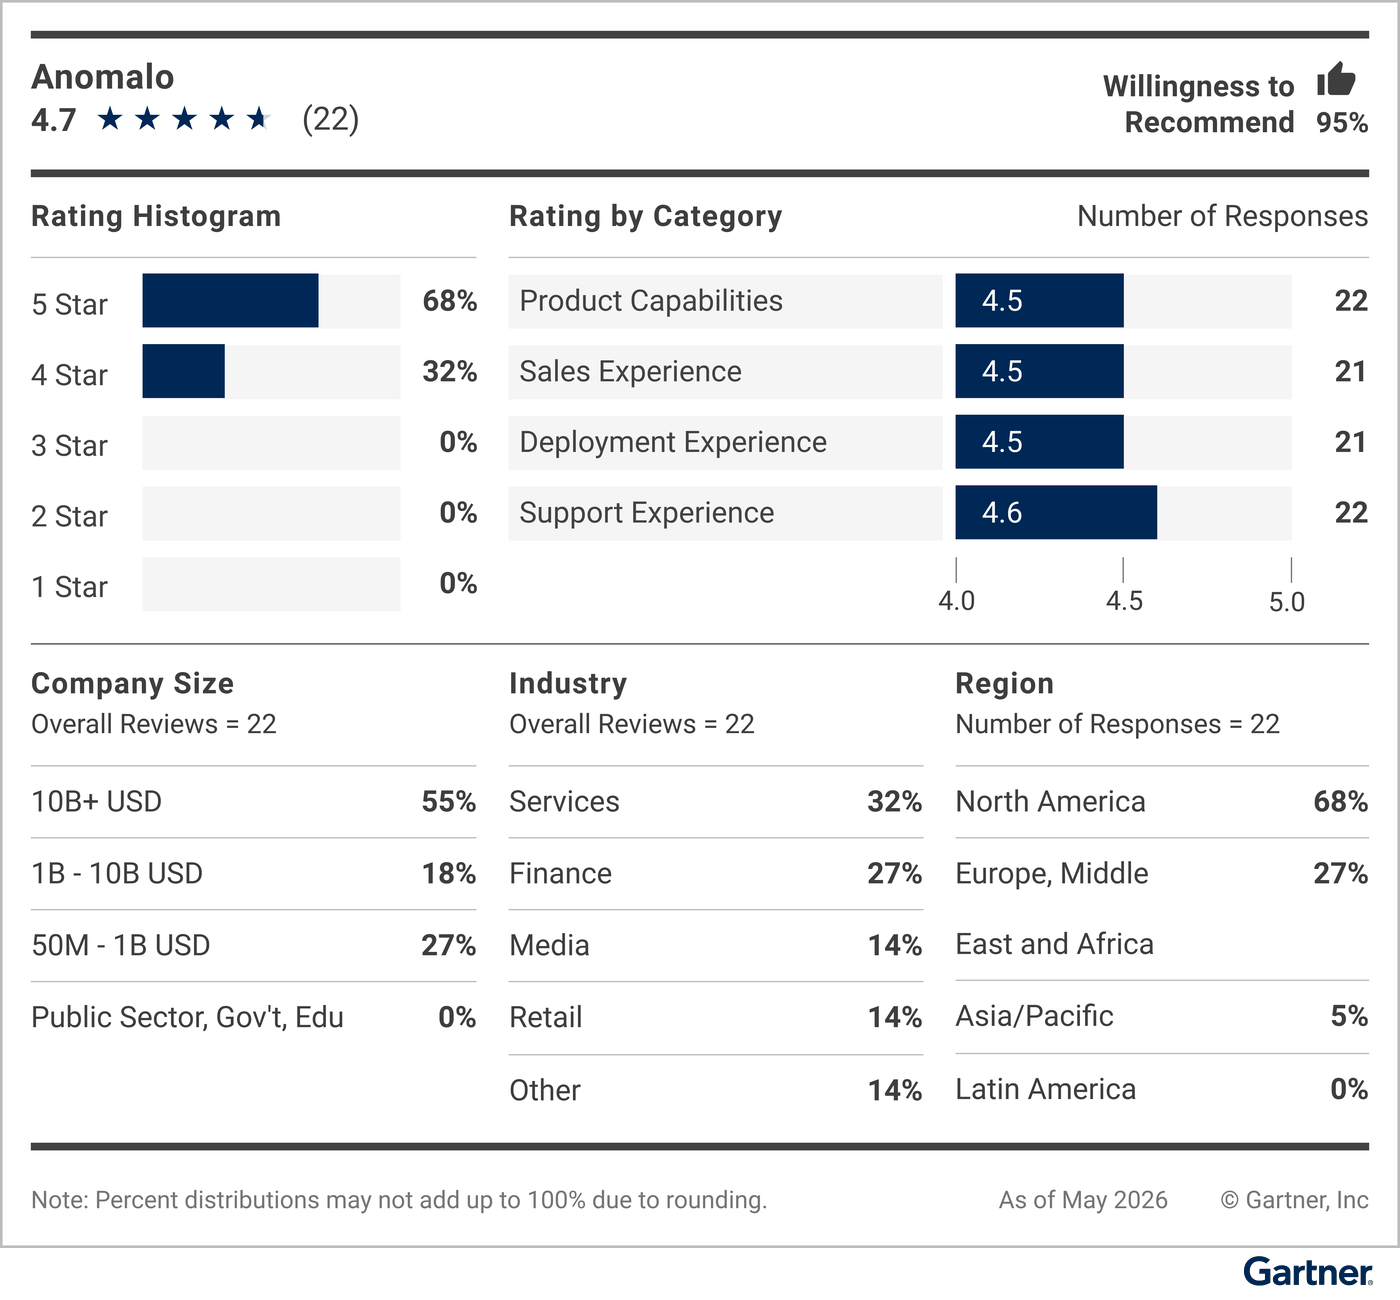
Read all Peer Insights user reviews for Anomalo.
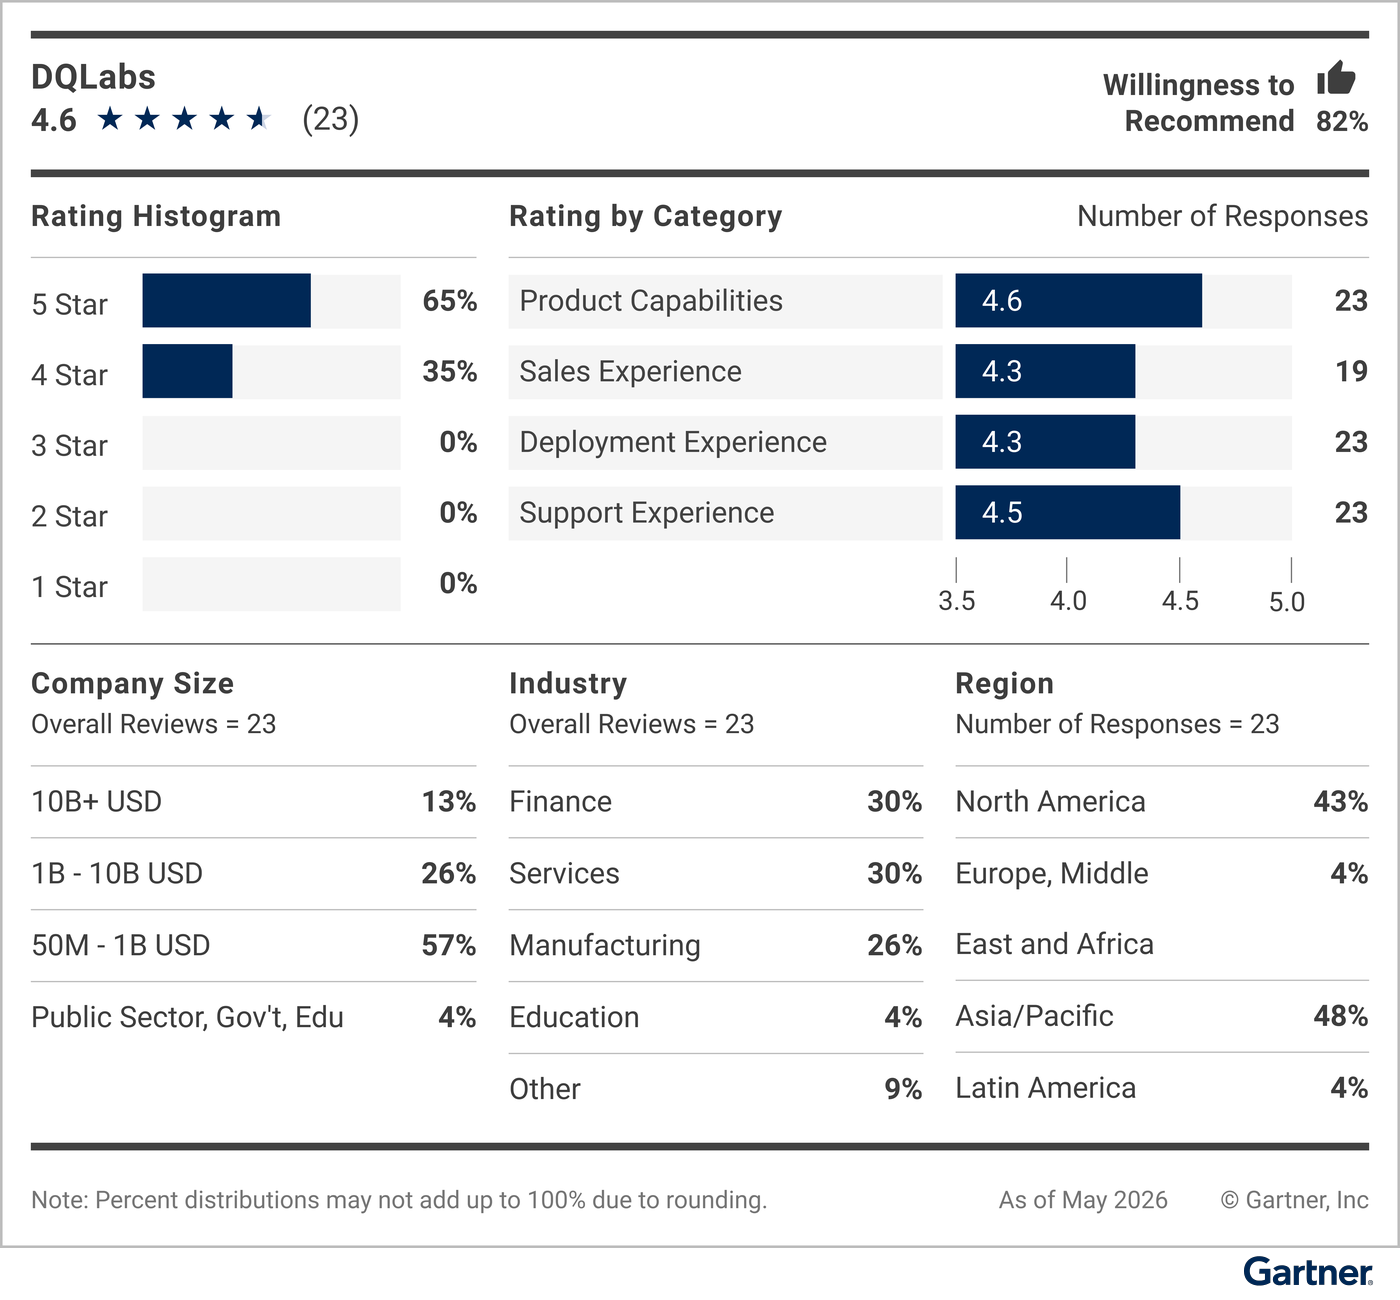
Read all Peer Insights user reviews for DQLabs.
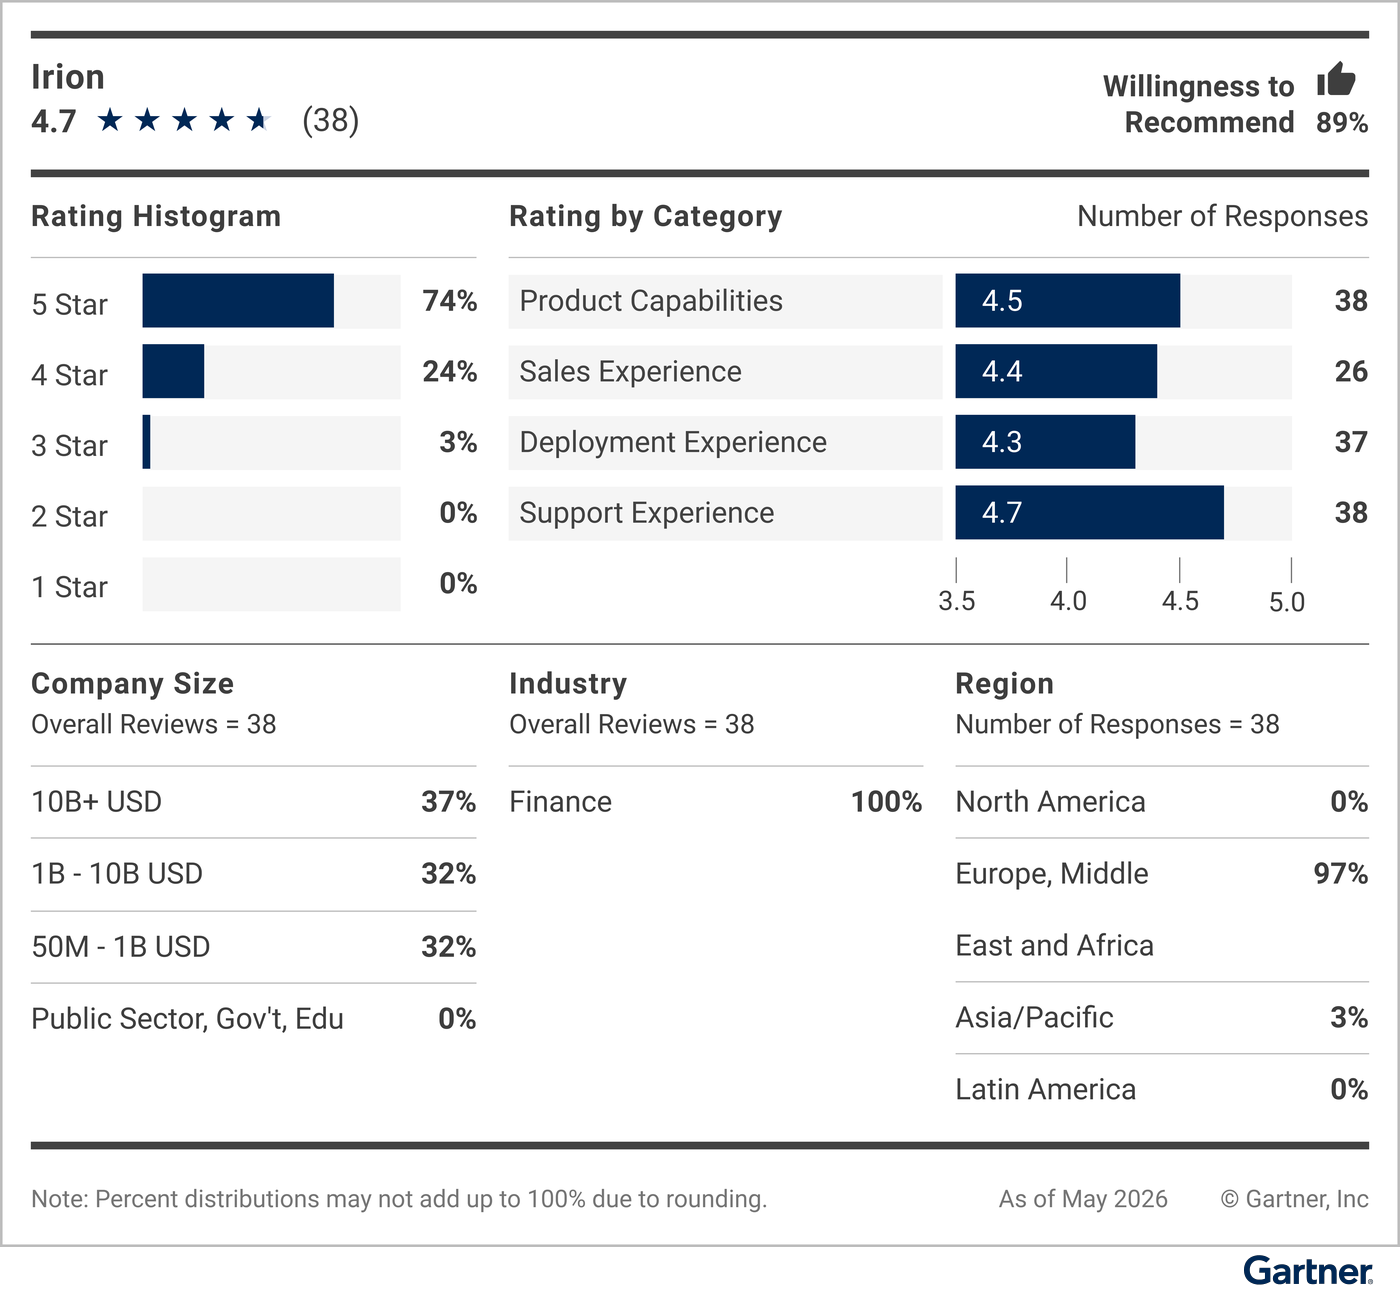
Read all Peer Insights user reviews for Irion.
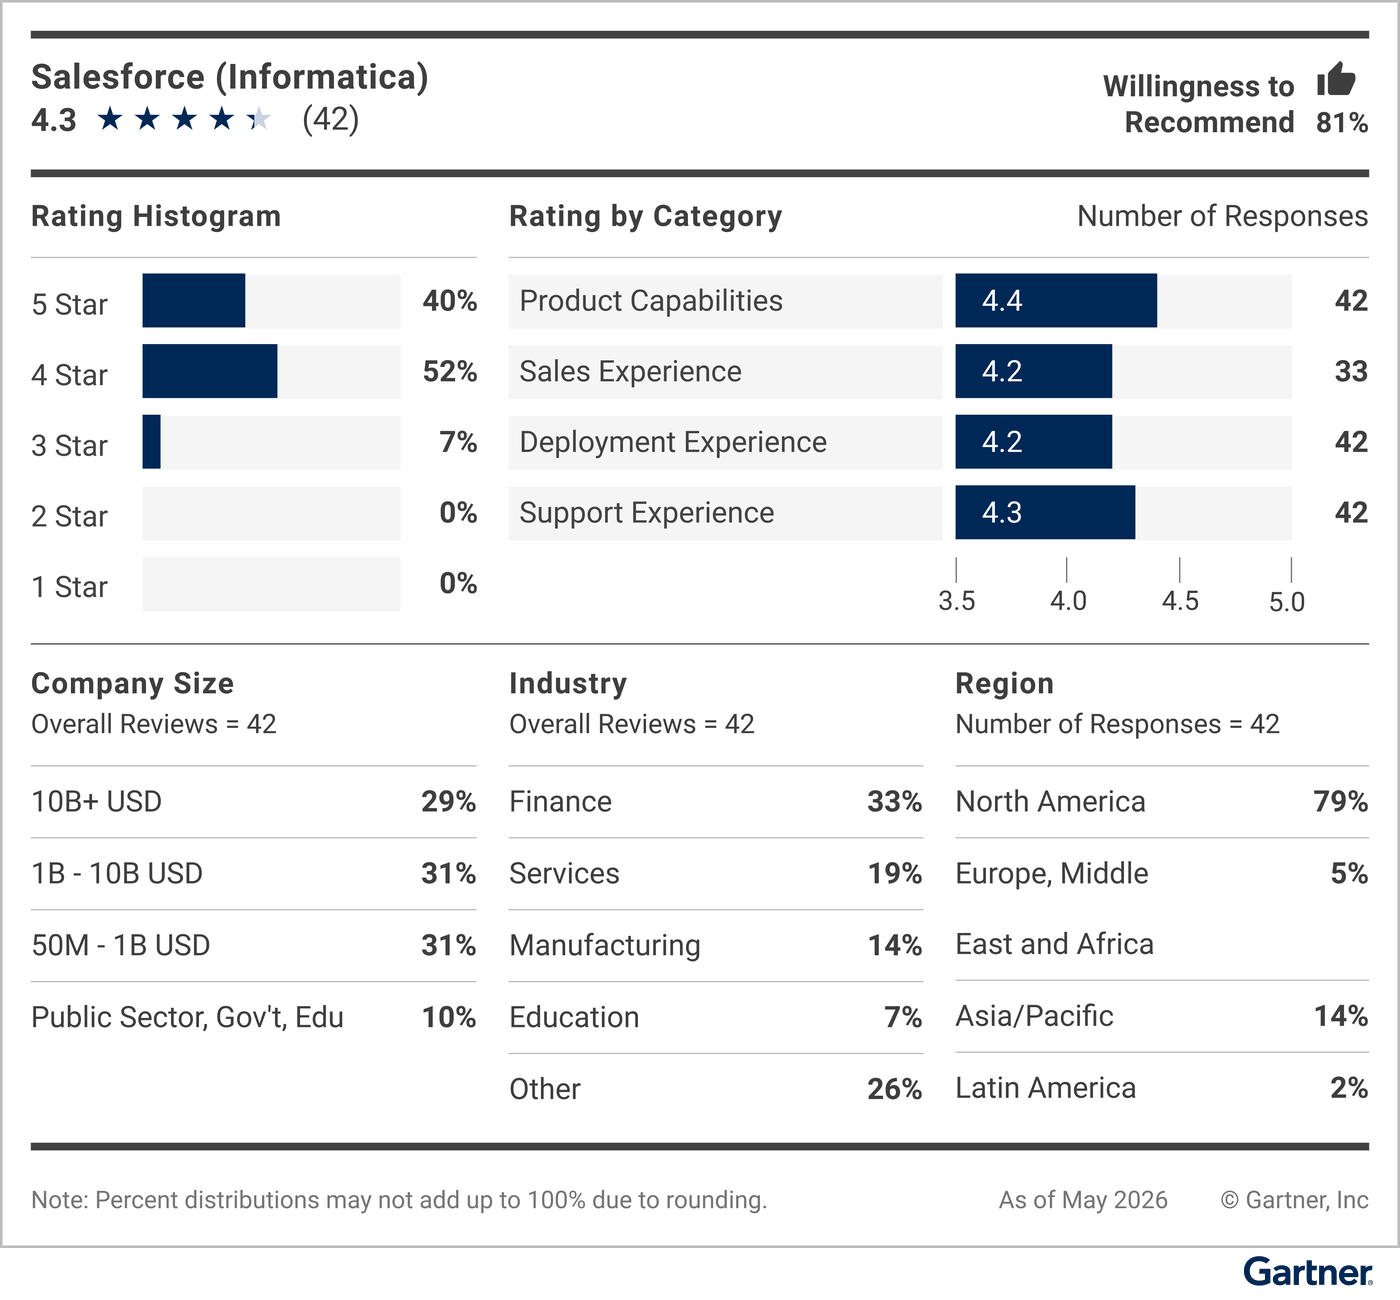
Read all Peer Insights user reviews for Salesforce (Informatica).
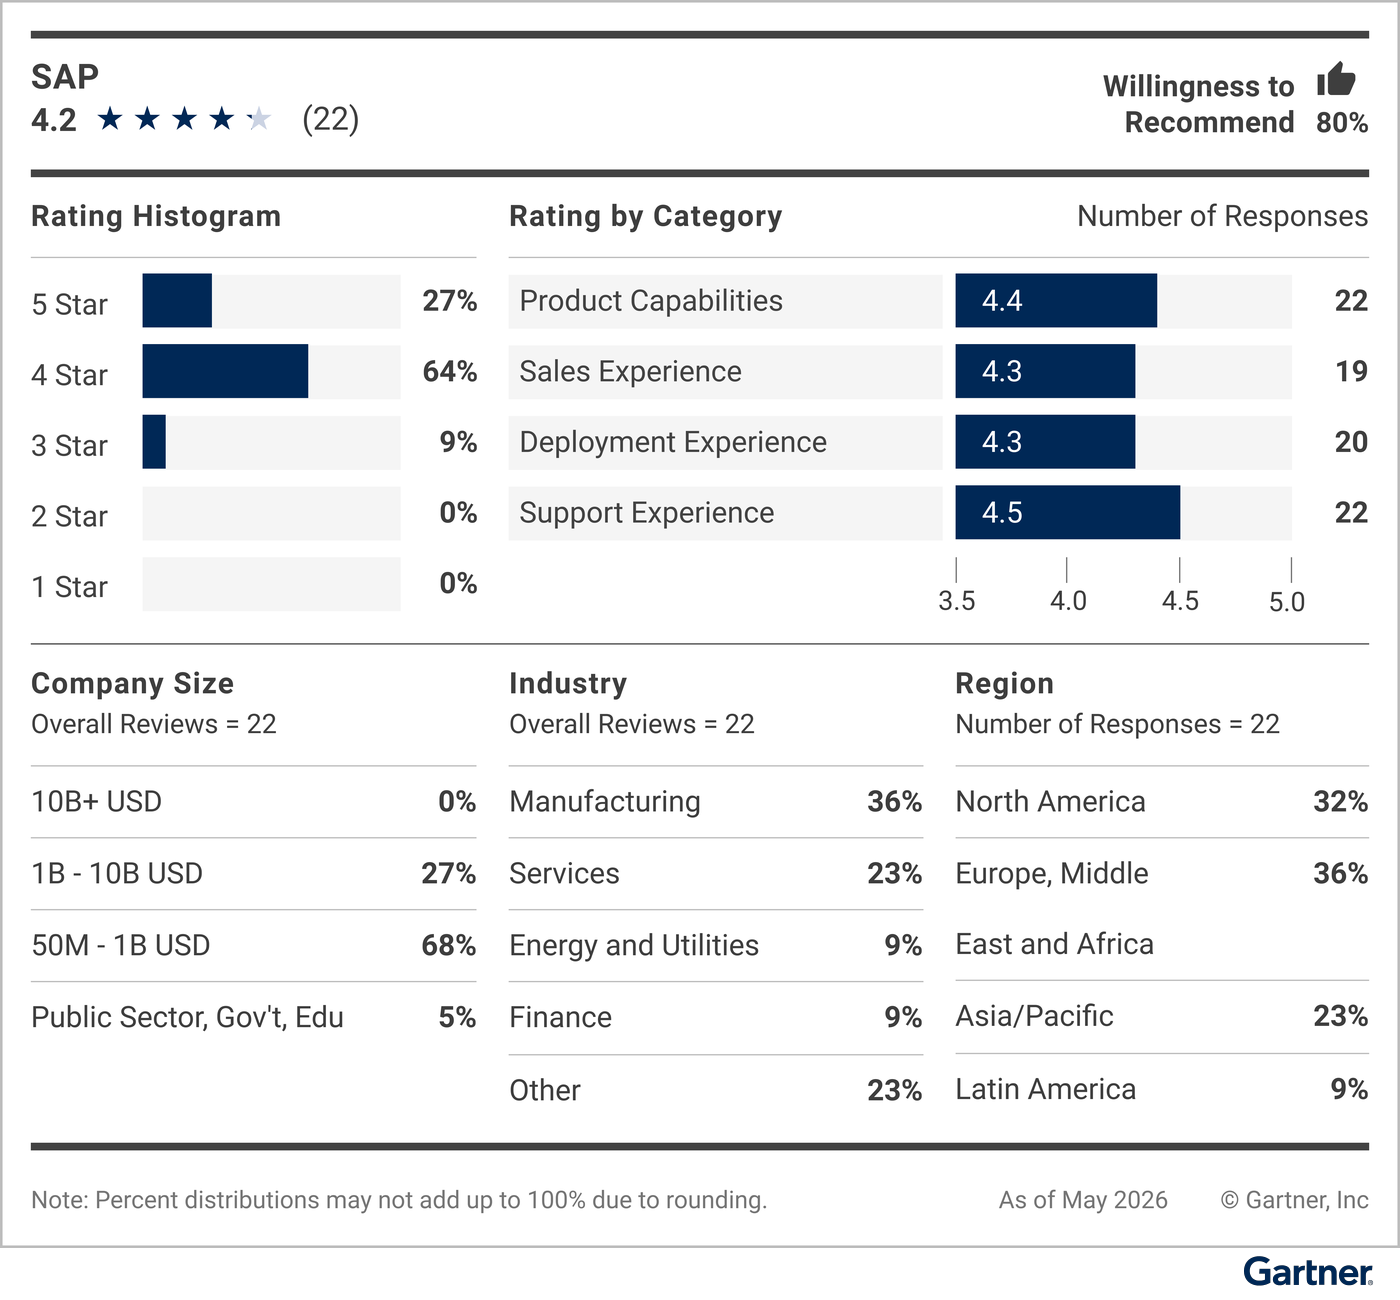
Read all Peer Insights user reviews for SAP.
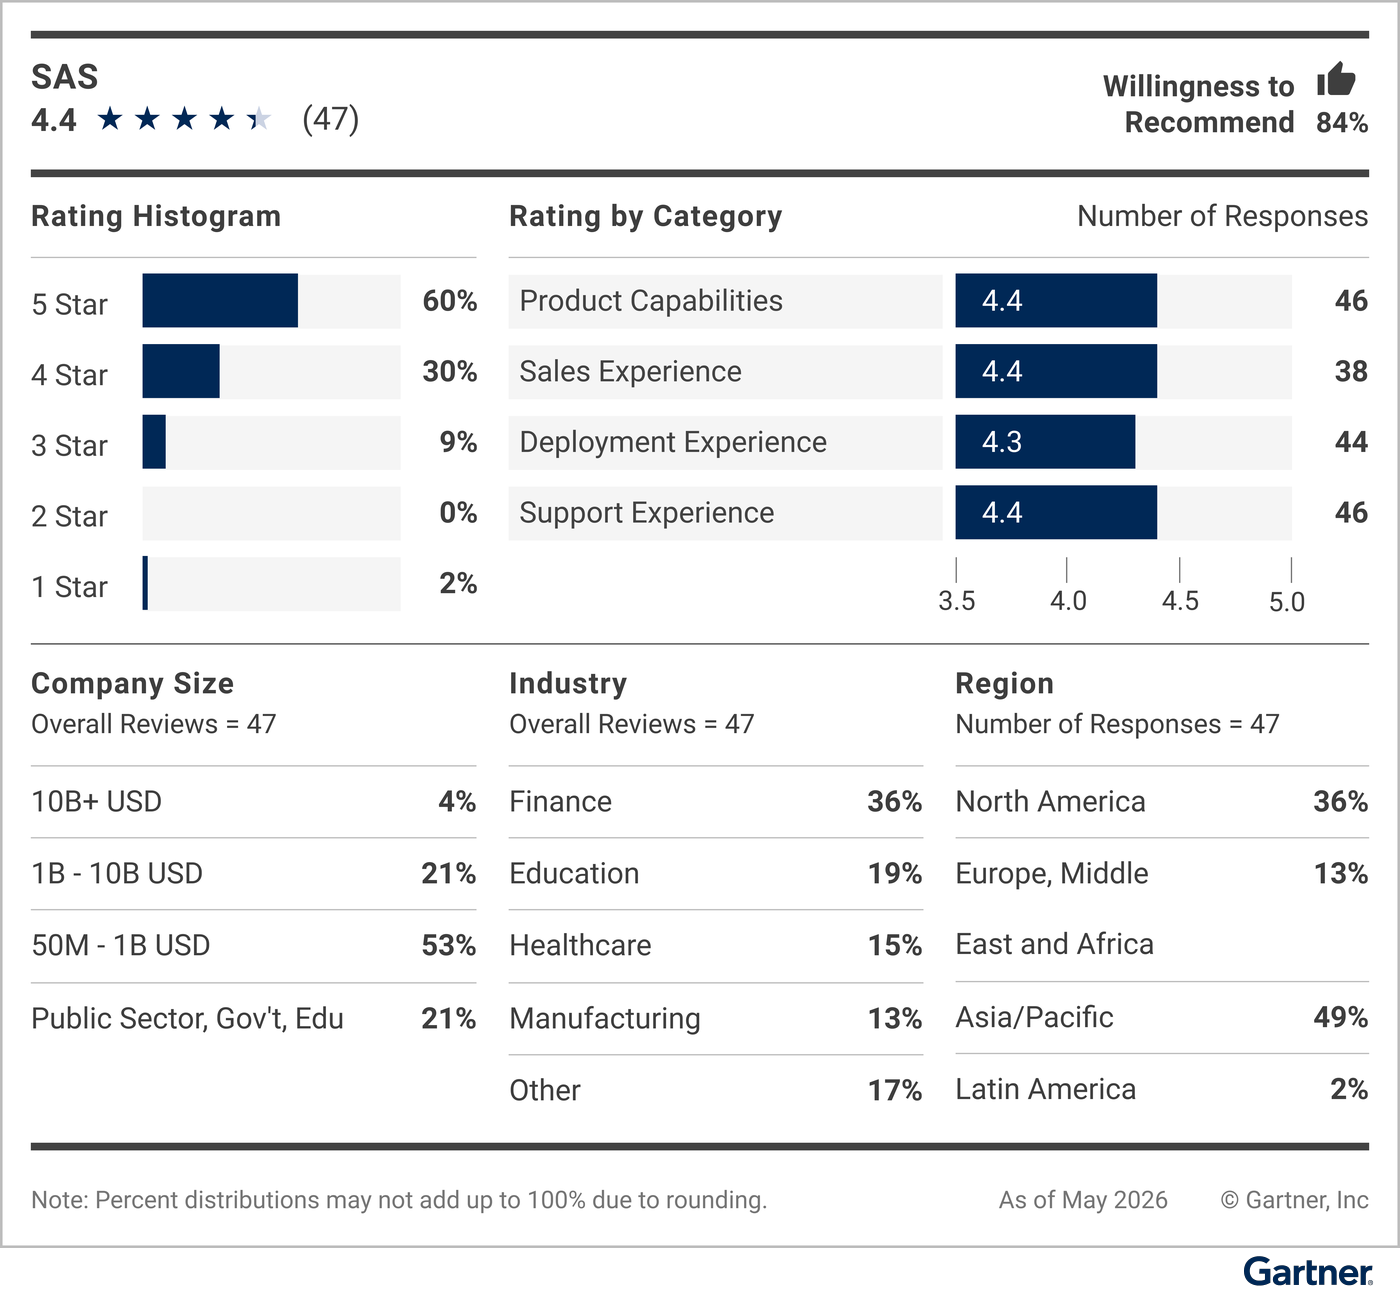
Read all Peer Insights user reviews for SAS.
Market Definition
Gartner defines augmented data quality (ADQ) solutions as a set of capabilities that deliver advanced features to streamline the identification of quality issues, offer context-aware suggestions for corrective actions, and automate key data-quality processes to ensure cleaner, more reliable data. These purpose-built data quality solutions support profiling and monitoring, rule discovery and creation, active metadata use, data transformation, data remediation, matching, linking and merging, and role-based usability. The solutions have AI-assistant-enabled features that enhance user experience.
Methodology
A full description of the methodology can be found on the Gartner Peer Insights Voice of the Customer Methodology page.
Voice of the Customer includes vendors with products aligned to the market that have 20 or more eligible published reviews (and 15 or more ratings for “Capabilities” and “Support/Delivery”) during the 18-month consideration period ending 31 May 2026. Reviews from vendor partners or companies with less than $50 million in revenue are excluded.
In the augmented data quality solutions market, Gartner Peer Insights published 518 reviews and ratings during the consideration period.
The data used in this report is drawn from reviews on Peer Insights, a free peer review and ratings platform that regularly publishes new reviews. The Voice of the Customer methodology uses a snapshot of reviews data from a defined time frame and does not automatically update as new reviews are published. The external Peer Insights site will always have the most updated peer view of the vendors and products in this report.
The numerical ratings scores in each vendor summary graphic (shown as “Rating by Category”) are best interpreted as sample statistics with a reasonable margin for error and not as exact values.