Magic Quadrant for Digital Experience Monitoring
27 October 2025 - ID G00823799 - 38 min read
By Padraig Byrne, Pankaj Prasad, and 4 more
DEM tools monitor the availability and performance of modern and legacy applications to gauge the end-user experience of employees and customers. Heads of I&O can use this Magic Quadrant to shortlist DEM vendors.
Market Definition/Description
This document was revised on 27 October. The document you are viewing is the corrected version. For more information, see the Corrections page on Gartner.com.
Gartner defines digital experience monitoring (DEM) as the measurement of the availability, performance and quality of the user experience of applications. This can include internal users (employees), external users (customers and partners) or a digital agent connecting to an API. In addition to performance, DEM enables observability of user behavior and journeys based on their interaction with applications.
DEM tools allow I&O leaders to understand the availability, performance and reliability of business applications, networks and infrastructure by focusing on understanding the user experience. This is in contrast to other performance monitoring approaches, such as observability platforms, that understand the inner workings of applications.
“User” is defined broadly for DEM tools and may include internal and external users or even digital agents. Use-case examples include understanding the performance and availability of:
- Employees accessing applications critical to their role (e.g., intranet, CRM website)
- Outsourced third-party applications/services where there is no way to directly instrument the outsourced environment
- Customers accessing a commercial website (e.g., retail or online banking application)
- Digital agents connecting to important APIs, ensuring the availability and performance of critical digital components
DEM tools also:
- Help enterprises proactively identify application performance degradation from a user’s point of view
- Understand user behavior and journeys within the application
- Help track important applications’ SLAs
- Enable benchmarking of application performance and issue identification before users are affected (e.g., before and after component upgrade)
- Provide data to help identify the best opportunities to improve website performance
While DEM tools are useful in understanding customer behavior, they differ from customer experience analytics tools in that the primary focus is on measuring the impact of application performance on customers/users. Tools that focus primarily on customer experience are not included in this market.
DEM tools also differ from digital employee experience management (DEX) tools, as DEM focuses more broadly on digital experience for customers or employees, and infrastructure components. DEX focuses exclusively on the digital experience of employees through their company-provided physical and virtual endpoints accessing approved applications and services. DEX incorporates organizational and employee sentiment data, and acts to resolve identified issues. Solutions offering endpoint-only monitoring, or those that focus on or are only provided within security or vendor VPN implementations, are excluded from this research.
Mandatory Features
- Measurement of the health and performance of an IT system from an external, front-end interface perspective, either via a UI or an API.
- Ability to visually display an end-to-end representation of a request, journey or interaction with the system showing points of intersection with system components.
- Ability to interrogate the system to answer questions about the impact that the health and performance of the system has on the user experience or behavior.
Common Features
- Real user monitoring (RUM) — records the interactions of real users within a web application
- Synthetic transaction monitoring (STM) — simulated user interaction through scripts, bots, network traffic simulation or API tests
- Multiple geographic points of presence for synthetic transaction monitoring, and the option to deploy private agents for increased visibility
- Analysis of RUM telemetry, including session replay and customer journey mapping
- SaaS application performance and availability monitoring
- Benchmarking key performance metrics for establishing baselines and comparison and trend analysis
- Provide actionable insights through the use of advanced analytics and machine learning that are otherwise not possible or feasible to derive through manual interrogation and analysis of data.
- Support for browser emulation and automation languages such as Selenium, Cypress, Playwright and Puppeteer
- Internet performance monitoring — ability to provide insight into cloud services and the optimum paths available
- Thick client monitoring — capability to deploy DEM to non-web-based interfaces
- Integration with adjacent domains such as security monitoring and software testing
- Mobile application monitoring via software development kits (SDKs)
- Integrations with application performance monitoring or observability platforms to see a drill-down at the transaction level that shows how the application spends time when responding to a user request
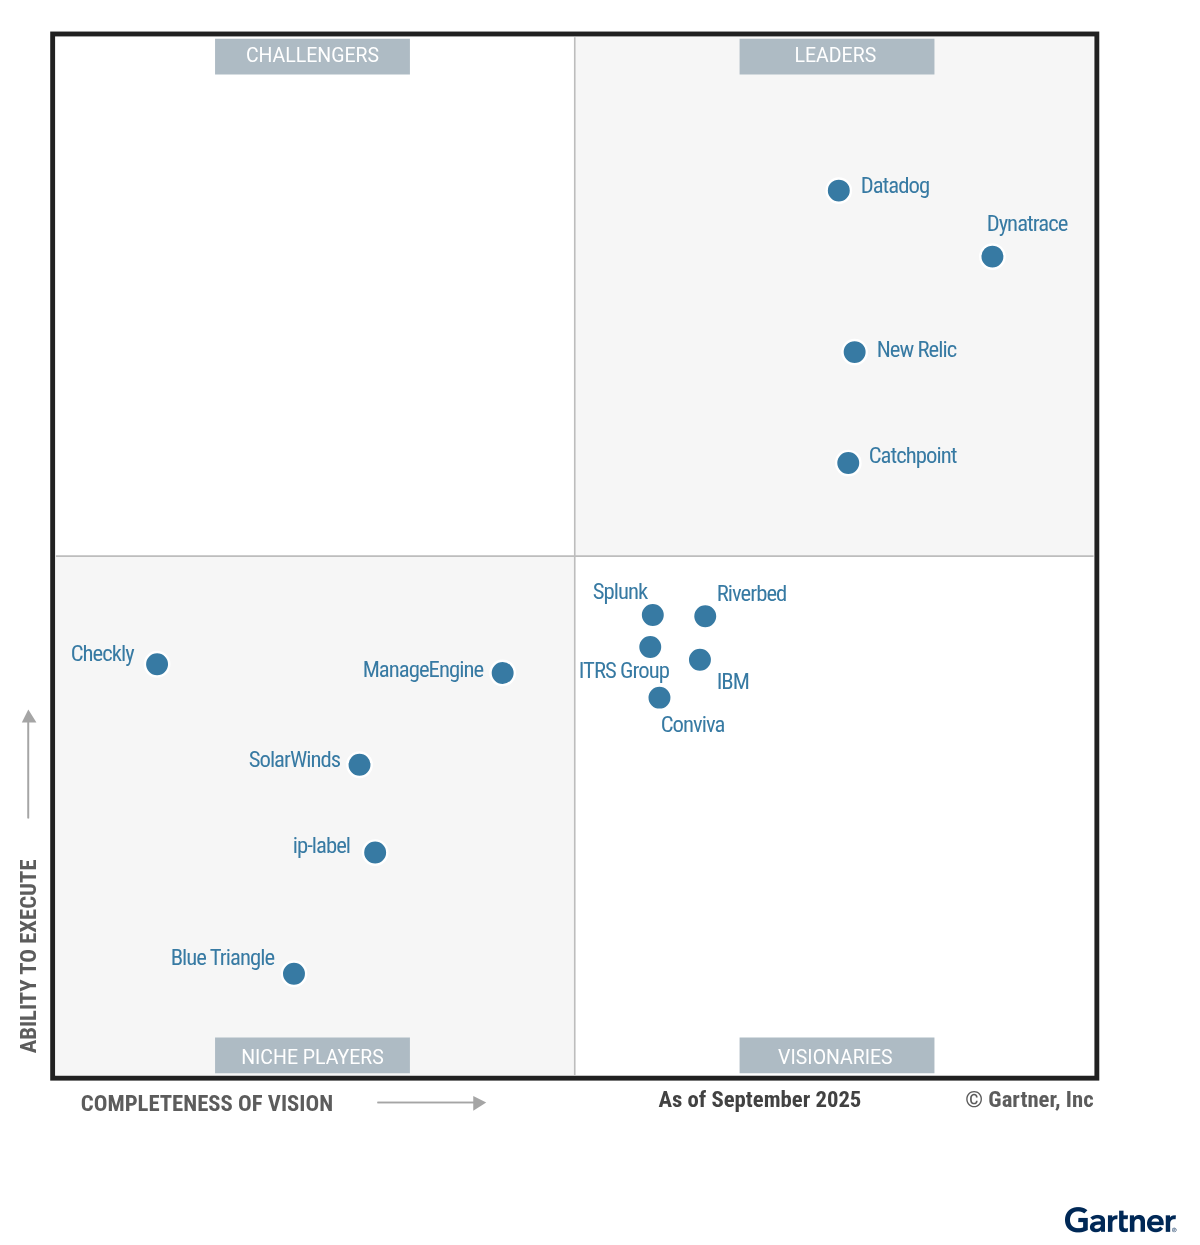
Magic Quadrant
Vendor Strengths and Cautions
Blue Triangle
Blue Triangle is a Niche Player in this Magic Quadrant. Its product is focused on enhancing digital experience through the identification and quantification of digital friction on web and mobile apps, offering remediation guidance and measuring ROI. Its operations are mainly focused in North America, with additional operations in Europe and a small footprint in LATAM and APAC. Its customers tend to be primarily in the retail sector. Blue Triangle has formed strategic technology alliances with major vendors such as Google Cloud and Microsoft. Blue Triangle’s roadmap emphasizes expanded AI capabilities, enhanced cross-team collaboration, and new iOS traffic metrics.
- Customer scale: Blue Triangle serves large enterprises — including major retailers, and travel and healthcare organizations — with demanding requirements for website performance and availability. Its solution is designed to be easily deployed, scalable and cost-effective, supporting the needs of high-traffic, customer-facing digital environments.
- Business-outcome focus: Blue Triangle provides detailed quantification of how specific user experience issues translate into conversion losses and revenue impact. Its conversion rate curve methodology and revenue attribution features allow organizations to identify and prioritize the most costly friction points on their digital properties, supporting data-driven decision making for optimization efforts.
- Hybrid visibility: Blue Triangle’s platform provides detailed performance insights for modern web environments, including metrics for single page applications (SPAs) and core web vitals. These capabilities are delivered through a combination of real user monitoring (RUM) and synthetic transaction monitoring (STM) that includes error tracking and session playback.
- Network insight: Network path analysis is limited in functionality, making proactive trace analysis a challenge.
- Geographic strategy: The vendor’s primary focus is North America, with limited investment in other regions and no detailed information on localization or language support. This may be a concern for multinational clients needing localized experiences, support, and compliance in multiple geographies.
- Product strategy: Blue Triangle’s strategy and roadmap maintain clear room for expansion in comparison with other vendors. Clients making a strategic purchase for their DEM should evaluate Blue Triangle’s roadmap against their specific requirements.
Catchpoint
Catchpoint is a Leader in this Magic Quadrant. Its Internet Performance Monitoring (IPM) platform is focused on providing visibility into real user experiences and the internet stack. Its portfolio of DEM solutions includes Internet Synthetic Monitoring, RUM, web performance optimization, BGP monitoring and Internet Sonar. Its operations are geographically diversified, and its customers tend to be large enterprises across a variety of industry sectors. Catchpoint’s roadmap includes deepening AI investment for root cause analysis and intelligent agents.
- Product strategy: Catchpoint has a clearly articulated product roadmap and strong vision that prioritizes key innovations in AI and intelligent agents. This forward-looking strategy addresses emerging customer needs for advanced, AI-enabled monitoring and analysis.
- Integration and extensibility: The platform offers extensive integrations with major analytics, database, and observability platforms, including Datadog, Dynatrace, ClickHouse, Snowflake, and Databricks, alongside flexible data export and ingestion APIs supporting OpenTelemetry. This enables two-way data flow for advanced analytics and correlation, reducing integration complexity for customers.
- Customer enablement: Catchpoint provides a comprehensive training and certification program through a mix of online and in-person resources, including Catchpoint University and strategic workshops. This structured approach to customer enablement accelerates user adoption and helps organizations maximize the value of their investment.
- Platform scope: As a specialized DEM solution, Catchpoint is not part of a broader observability platform. This may present challenges for enterprise clients seeking a single, integrated solution to correlate user experience data with back-end application and infrastructure telemetry.
- Immature session replay: The vendor’s session replay capability is in the early stages of development and does not yet offer the same range of features as some competing offerings. Organizations that heavily rely on session replay for diagnostics may find the current functionality limited.
- Pricing information: Unlike other Leaders in this research, Catchpoint does not publish pricing information on its website. This lack of transparency is not in line with general trends in this area and hampers potential customers when estimating costs.
Checkly
Checkly is a Niche Player in this Magic Quadrant. Its DEM offering consists of Monitoring, Traces and Status Pages products, which are focused on synthetic monitoring of web applications and APIs. Checkly has clients in all geographies, with its major presence and focus in the North America and EMEA regions. Checkly’s customers are midsize to large enterprises across various industries. The vendor’s roadmap includes broadening of uptime monitoring with native support for protocols like SSL and leveraging AI for creating synthetic checks, monitors, and root cause analysis.
- Developer-centric: Checkly supports CI/CD and config-as-code integration, enabling teams to define and manage monitoring alongside application code.
- AI capabilities: Checkly’s AI agent, Rocky, integrates with common LLMs, enabling faster monitoring failure analysis, better context, and root cause identification, which helps reduce the diagnosis and troubleshooting time.
- Simple licensing: Checkly offers transparent four-tier licensing, allowing customers to switch between tiers with the option to add additional checks, as needed, avoiding unnecessary costs or overpayment.
- Feature parity: Checkly lacks real user monitoring (RUM) capability, which may not address all requirements for application owners and customer experience specialists.
- Limited IT operations use: Checkly lacks IPM features such as monitoring external network paths and ISP performance. IT operations teams seeking deeper network visibility may need to explore additional solutions to address these requirements.
- Product development: While Checkly offers many unique features, its roadmap for AI-enabled digital experience monitoring was less clearly articulated than those of leaders in this market.
Conviva
Conviva is a Visionary in this Magic Quadrant. Its DEM offering consists of Conviva Digital Product Insights (DPI) and Video Streaming Insights (VSI), providing real-time, outcome-based performance analytics for applications, websites, streaming video and AI agents in production environments. Conviva serves a global client base, with representation in North America, EMEA, LATAM, and APAC. Its clients include large media streaming and e-commerce organizations. The vendor’s roadmap includes plans for expansion into further e-commerce, travel and hospitality, and B2B use cases; and AI agentic analytics use cases.
- Machine learning and analytics: The platform automatically learns normal behavior for user cohorts (by device, OS, geography, campaign, etc.) and alerts when a specific cohort deviates from baseline. It then ties that cohort to the back-end call involved so teams see immediately which user group is affected and what to fix — without manually defining cohorts.
- Streaming video expertise: Conviva has a proven track record of monitoring high-volume, high-velocity streaming video environments. This expertise in real-time telemetry analysis is applicable to other data-intensive industries, such as e-commerce, that require immediate performance insights.
- Differentiated approach: Conviva employs a differentiated, data-centric approach to understanding the end-user experience, setting it apart from traditional DEM vendors. This methodology focuses on deep analysis of telemetry data to model and interpret user interactions.
- Pricing model: The vendor’s pricing is not publicly available and is based on a complex model with a large number of metrics. This lack of transparency can create challenges for prospective clients in forecasting costs and may lead to budget unpredictability.
- Enterprise expertise: Conviva’s experience and product development historically have been centered on the streaming video sector. Consequently, its expertise in addressing the complex, cross-functional requirements of large enterprises in other industries is less proven than that of competitors with a broader enterprise background.
- Synthetic monitoring: The platform lacks a native synthetic monitoring component. Organizations that require proactive monitoring of application availability and performance through simulated user transactions will need to integrate a third-party solution.
Datadog
Datadog is a Leader in this Magic Quadrant. Its DEM solution consists of Synthetic Testing and Monitoring, Real User Monitoring, Session Replay, Product Analytics, and Error Tracking. Its operations are geographically diversified, and its clients span customers of all sizes and industries. The company recently made several notable acquisitions: Quickwit (log search optimization), Metaplane (data observability) and Eppo (feature flagging and experimentation). Datadog’s roadmap includes plans for full agentic investigation journeys from what happened and why, to resolution and canary rollout pipelines using feature flags.
- RUM pricing: Datadog’s new “without limits” model, which replaces previous usage-based pricing, allows flexibility by decoupling session ingestion from indexing, allowing dynamic retention filtering without code changes. This enables selective retention of high-value sessions, while discarding less relevant ones.
- Product analytics: The platform utilizes RUM, funnel analysis, pathways, session replay, and heatmaps to provide insights that help teams understand product adoption, user behavior, and feature prioritization. Product analytics is available for all U.S.- and EU-hosted Datadog accounts.
- AI-powered insights: Datadog’s AI engine automatically detects performance anomalies by baselining normal behavior across the front and back end without manual configuration. It then correlates relevant events and provides a plain-language summary of the issue, helping teams accelerate their understanding and response.
- SaaS only: Datadog is offered exclusively as a SaaS solution. For organizations with strict regulatory, compliance, or data-residency requirements, the lack of self-hosted or self-managed options may present limitations in meeting internal governance standards.
- Limited IPM capability: Datadog’s current approach to IPM relies heavily on manual analysis of RUM performance or STM traceroute data, unlike competitive alternatives that offer automated, AI-driven approaches.
- Scope: As part of a comprehensive observability platform, Datadog’s DEM capabilities may be overly expansive for organizations seeking a focused, stand-alone DEM solution.
Dynatrace
Dynatrace is a Leader in this Magic Quadrant. Its DEM offering includes capabilities for RUM, synthetic monitoring and session replay, powered by Dynatrace’s Davis AI engine. Dynatrace has clients in all major geographies, including LATAM and APAC, but its primary focus is on the North America and EMEA regions. Dynatrace’s customers tend to be large enterprises and technology-centric companies. The vendor’s roadmap includes enhancements to further agentic AI integrations with strategic partnerships and AI observability toward observing AI workloads for guardrails, cost and performance controls, agent explainability, and debugging prompts, and their impact on user experience.
- Automated configurations: Dynatrace uniquely combines API, Terraform and its own Monaco CLI to enable configuration as code for DEM, including RUM and synthetic monitors. This approach allows teams to version, reuse, and automate DEM configurations across environments, reducing manual and supporting effort.
- Security compliance: Dynatrace offers multilayer personally identifiable information (PII) masking at capture, storage and display stages, with configurable rules per process group or log source. This ensures sensitive data is protected throughout the DEM pipeline and supports compliance with GDPR, CCPA, HIPAA, PCI-DSS, and other regulations without manual intervention.
- AI capabilities: The platform’s embedded AI, including Davis AI and Davis CoPilot, translates complex telemetry into natural language insights using causal, predictive and generative AI. This makes deterministic performance data accessible and actionable for a wide range of stakeholders, allowing clients to more easily pinpoint technical issues with their direct impact on business outcomes.
- Basic IPM: Compared with other features, Dynatrace’s internet performance monitoring is relatively limited for geographic internet health visibility and not a core strength of the platform.
- Single sign-on (SSO) for STM: Dynatrace does not act as an identity provider (IdP) for synthetic monitoring. This may limit flexibility for enterprises needing provider-side federation or turnkey simulation of SSO flows in synthetic tests.
- Onboarding: Dynatrace’s extensive flexibility and rich data insights are useful for SRE and the I&O team; however, the breadth of features can be overwhelming for some new users, particularly application owners, especially when setting up dashboards and selecting relevant metrics and KPIs.
IBM
IBM is a Visionary in this Magic Quadrant. Its Instana offering includes capabilities for real user monitoring and synthetic monitoring. It supports OpenTelemetry and leverages generative AI for dynamic analysis of trace statistics to support probable cause analysis. IBM’s Instana Observability platform is offered as both a SaaS solution and a self-hosted offering. IBM’s operations are geographically diversified, and Instana’s client base is midsize-to-large enterprises across a wide range of industries. IBM’s roadmap includes strengthening support for SRE and developers through CI/CD integration and improving business user visibility into user impact due to infrastructure issues.
- Deployment models: IBM Instana supports SaaS, self-hosted and air-gapped deployments, with installation options for Kubernetes, OpenShift, Docker and VMs. This flexibility enables clients to meet operational and compliance requirements and exercise a high level of control over their data sovereignty, regulatory or national requirements.
- Market presence: IBM’s global reach, large customer installed-base and extensive product portfolio make it a strong choice for larger organizations seeking a single vendor to cover their broader observability needs.
- Use of AI: IBM Instana minimizes the need for manual intervention and accelerates troubleshooting through AI-driven insights by leveraging causal AI and anomaly detection to group alerts into incidents, identify likely causes, and recommend diagnostic actions.
- Features: IBM Instana lacks session replay capability, which is key to understanding how application performance impacts user experience and the resultant behavior, including rage clicks or shopping cart abandonment. It is one of the key capabilities leveraged by customer experience specialists. Instana intends to enable session replay capabilities in the product in the first half of 2026.
- Privacy controls: IBM Instana relies on default data minimization and manual SDK settings for personally identifiable information (PII control), with only basic options to redact secrets or exclude URLs. It does not provide automated obfuscation or multistage masking across capture, storage and display, or audit logging, potentially increasing effort for organizations with strict privacy requirements.
- Roadmap differentiation: IBM Instana’s future enhancements are primarily focused on DevOps and SRE use cases. For application owners, planned features such as business metric correlation and conversion tracking are already well-established in competing products and may not provide a distinct advantage over other offerings.
ip-label
ip-label is a Niche Player in this Magic Quadrant. Its Ekara platform delivers unified monitoring of internal and external client-facing applications, including Citrix virtual apps and desktops, thick-client desktop software, business apps, APIs and real-device mobile apps. Ekara is available as both a SaaS offering and a self-managed private platform, with multitenant and data-sovereignty options. Its operations are primarily focused in Europe. It serves mainly enterprise customers across a range of industries. The vendor’s roadmap includes expanded AI capabilities for anomaly detection, automation of incident qualification, and monitoring of agentic AI systems.
- Virtual and desktop application monitoring: In addition to web applications, Ekara delivers unified synthetic monitoring across Citrix, Microsoft RDS and thick-client desktop applications (SAP GUI, Windows apps, AVD, AppStream), alongside web and real-device mobile monitoring.
- Flexible consumption-based pricing: Ekara’s costs are directly tied to synthetic execution counts and RUM metric volumes, eliminating separate license fees and allowing customers to align monitoring spend with predictable, variable cost that reflects their application’s activity levels rather than a fixed overhead.
- AI-powered scripting: Ekara Studio enables automatic creation of synthetic user journeys using natural language processing (NLP). This no-code capability allows business users to define monitoring scenarios with minimal manual effort, improving accessibility and reducing setup time.
- Geographic strategy: ip-label’s primary customer base and operational presence remain in Europe, with APAC and North America operations still maturing. Organizations outside EMEA should confirm local support and deployment timelines.
- AI maturity: Ekara Studio is functional for NLP-based scripting, but broader AI features such as Incident Guard for false-positive filtering are still maturing. These capabilities require user validation and tuning before full automation can be relied on.
- Nonpublicly available pricing: Ekara’s pricing details are not published online, requiring customers to engage directly with ip-label for quotes and consumption models. This can slow business case development, procurement, and budgeting processes.
ITRS Group
ITRS Group is a Visionary in this Magic Quadrant. Its Uptrends SaaS product offers synthetic monitoring, real user monitoring and API monitoring. ITRS Uptrends integrates with the wider ITRS portfolio for observability, which includes application, infrastructure and cloud monitoring products. Its operations are focused in North America and Europe, with a smaller percentage in LATAM and APAC, and it serves customers in a wide range of industries. The vendor’s roadmap includes investments in AI for natural language-based monitoring and intelligent alerting.
- Analytics-driven insights: ITRS’s DEM solution integrates with ITRS Analytics, the company’s observability platform. This advanced analysis allows customers to uncover business-level insights, which enables better decision making to maximize performance and reduce operational risk.
- Market understanding: ITRS shows a strong market understanding of the key challenges confronting its clients and the market generally. This awareness ensures its product strategy and roadmap are aligned with the practical and evolving needs of IT operations teams.
- Industry expertise: ITRS has a proven track record in the demanding financial services sector, making its experience in mission-critical environments applicable to other industries with stringent operational requirements.
- Partner program: ITRS lacks a formal partner program, which may limit its market reach and implementation capabilities for clients seeking third-party support or localized expertise.
- Pricing model: While pricing is public, its credit-based model varies by component, which can make budget planning difficult for clients and lead to challenges in forecasting total cost of ownership.
- Feature gaps: The platform lacks certain key features, such as customer journey mapping and internet performance monitoring, which are common in competing solutions. Organizations requiring these capabilities will need to integrate third-party tools.
ManageEngine
ManageEngine is a Niche Player in this Magic Quadrant. Its DEM capabilities are delivered via its SaaS-based product, Site24x7, a cloud platform focused on full-stack observability. Applications Manager and OpManager Plus are self-hosted offerings that provide application performance monitoring and observability, and full stack observability, respectively. ManageEngine’s operations are geographically diversified, with a focus in North America and EMEA, and its customers tend to be small to midsize enterprises across a variety of industries. The vendor’s roadmap includes investments in customer journey mapping to enable correlation of technical signals with user behavior and conversion goals, as well as root cause analysis based on agentic AI.
- Licensing and cost: Site24x7 offers a modular, usage-based licensing model, including scalable bundles allowing organizations to pay for only the features and monitoring volumes they need. Customers can selectively scale monitoring with options such as synthetic ping monitors, real browser monitors, real user monitoring (RUM), and mobile RUM.
- AI-driven insights: ManageEngine’s conversational AI assistant, zia, enables ease of insights to different personas and automates correlation of different datasets, such as session data and performance metrics, which can help improve overall MTTR.
- Deployment benchmarking: Site24x7 automatically benchmarks application performance before and after each deployment, instantly detecting deviations and triggering real-time anomaly alerts, enabling rapid identification of issues introduced by new releases.
- Innovation: ManageEngine’s product roadmap is focused primarily on strengthening core capabilities, with selective forward-looking innovations such as AI-driven insights and automation.
- Licensing structure: The modular, usage-based licensing model, while flexible, can be complex to navigate in scenarios where the requirements are broader and where monitoring volumes cannot be appropriately estimated.
- Functionality: The product lacks customer journey mapping, limiting its insights into user behavior, which may affect business owners’ ability to make decisions based on insights.
New Relic
New Relic is a Leader in this Magic Quadrant. Its SaaS-only DEM offering is integrated with APM, infrastructure, security, logs and AI monitoring. Recent enhancements include support for streaming media telemetry, expanded mobile frameworks (Flutter, .NET MAUI, watchOS) and an AI-driven session summary feature with natural language query generation. New Relic’s customer base consists primarily of large enterprises in the U.S. and EMEA, with expansion underway in APAC. The vendor’s roadmap includes investments in augmented AI DEM analyst technology and DEM for machine customers.
- Enable shift-left observability: By supporting Terraform, Pulumi and GitHub Actions for monitoring as code, New Relic DEM lets DevOps teams embed deployment markers, dashboards and browser instrumentation directly into CI/CD pipelines, reducing configuration drift and speeding time to value.
- Democratize troubleshooting with natural-language AI: The NRAI layer allows any user to pose plain-English queries against DEM data, receive AI-summarized session replays and provision synthetic tests, lowering reliance on specialized query languages and supporting accelerated RCA.
- Performance context in ITSM workflows: The bidirectional ServiceNow connector automatically creates and enriches incidents with DEM alerts, traces and metadata, ensuring that support teams receive actionable observability insights without manual hand-offs or tool switching.
- Geographic strategy: New Relic offers region-selectable hosting in the U.S. and Germany. Organizations in APAC or other regions may face latency or data-sovereignty challenges unless they deploy private synthetic locations.
- Pricing: New Relic’s consumption-based model offers flexibility, but cost predictability depends on effective use of ingest management and pipeline control. These capabilities provide strong control but require customer awareness and technical configuration, adding complexity for teams unfamiliar with advanced pipeline configuration or API-based controls.
- No discrete DEM licensing: DEM capabilities are bundled within New Relic’s unified observability platform, with no stand-alone SKU. While this simplifies procurement, it can complicate DEM-specific budgeting and cost attribution. Integrated optimization capabilities help to manage utilization, but these require adoption and awareness to avoid overprovisioning or underutilization.
Riverbed
Riverbed is a Visionary in this Magic Quadrant. Its Riverbed Aternity product is focused on digital experience monitoring across the endpoints, applications, infrastructure and network. Additionally, it can monitor the digital experience of employees. Its operations are focused mainly in the U.S. and EMEA, and its customers tend to be large enterprises across a variety of industries. Earlier this year, Riverbed acquired Zoomaya and turned it into its Aternity Replay, a feature that offers retroactive, device-level visibility into any web app, without prior instrumentation. The vendor’s roadmap includes AI capabilities to detect patterns, identify app errors and enable retroactive click-to-render investigations.
- Bring your own AI model: Riverbed IQ Assist, the vendor’s GenAI-powered virtual assistant, summarizes diagnostics and recommends next steps. It leverages an LLM-agnostic approach that gives customers the power to use an LLM of their choice.
- Deployment options: Aternity is delivered primarily as a SaaS solution, but it also offers self-managed deployment options, allowing organizations to host the platform on-premises or in their private cloud. This flexibility is useful for organizations with strict regulatory, compliance, or data residency requirements.
- Innovation: Riverbed recently launched SmartOTel to provide platform-level control and intelligent management of OpenTelemetry data streams. This will allow for deeper integration with DEM components, providing more precise diagnostics and user experience analysis.
- Nonpublic pricing: Unlike leading vendors in this market, Riverbed does not publish its pricing on its website. This lack of visibility makes it difficult for prospective customers to evaluate cost-effectiveness or compare Riverbed’s offering with other DEM solutions, potentially hindering informed decision making during vendor selection.
- Dependencies: The Aternity User Journey Intelligence (UJI) tool is an OEM rebranding of Blue Triangle, another vendor included in this report. As with any OEM arrangement, the tool’s roadmap and long-term stability may be influenced by contractual dynamics between the vendors, introducing potential uncertainty for customers.
- Geographic strategy: Riverbed does not maintain a direct presence in LATAM, instead supporting the region through their partner ecosystem. These partners provide sales coverage, implementation, and ongoing support for clients in the region. Clients should validate the expertise and local support capacity of the potential regional partner.
SolarWinds
SolarWinds is a Niche Player in this Magic Quadrant. SolarWinds Observability SaaS is a full-stack observability platform that includes RUM and STM features. The vendor also offers SolarWinds Observability Self-Hosted, which includes infrastructure, network and application monitoring capabilities. Its operations are geographically diversified, and its customers tend to be small, midmarket and emerging enterprises. SolarWinds’ roadmap includes plans to develop a session replay capability, RUM instrumentation for mobile applications, and synthetic monitoring for multifactor authentication protected applications, while continuing enhancement of its AI capabilities.
- Flexible deployment options: SolarWinds Observability supports both SaaS and self-hosted deployments, offering customers flexibility to choose the model based on their needs.
- RUM automation: SolarWinds Observability supports API-based life cycle management of RUM configurations, allowing users to create, update and delete monitoring setups programmatically. This enables teams to automate RUM deployment and integrate configuration into CI/CD workflows, supporting consistent and scalable observability practices.
- Partners: SolarWinds has a diverse partner program that helps with the promotion, distribution and support of the vendor’s products across different regions.
- Diluted DEM focus: SolarWinds’ marketing emphasizes comprehensive IT monitoring and holistic visibility, positioning DEM as one component within its full-stack observability platform. Notwithstanding resources like blogs and webpages dedicated to exploring its DEM solution, for buyers focused solely on DEM, this approach can make it harder to evaluate or justify SolarWinds for targeted use cases.
- Acquisition impact: The April 2025 acquisition of SolarWinds by private equity firm Turn/River Capital represents a major turning point for the organization. With new ownership, clients should anticipate potential changes in investment focus and strategy, and proactively evaluate any changes to the product roadmap, pricing, and support models.
- Functionality: SolarWinds does not support synthetic monitoring for multifactor authentication (MFA)-protected applications, limiting its suitability for organizations that require monitoring of secure, MFA-enabled environments.
Splunk
Splunk, a Cisco company, is a Visionary in this Magic Quadrant. Its DEM offering, Splunk Observability, comprises Splunk Observability Cloud and AppDynamics. Splunk’s global operations span all major regions, and its DEM customer base is predominantly large enterprises. The vendor’s roadmap centers on a unified UI/UX, deeper troubleshooting integrations (APM, ITSI, ITSM/AIOps) and expanded AI- and analytics-led DEM features.
- Prebuilt enterprise application monitoring: Splunk supports prebuilt monitoring for SAP, Microsoft 365, Salesforce and Webex. It combines real user and service-level visibility with over 30 business-process dashboards to accelerate root-cause analysis.
- Cross-domain network correlation: Integration with ThousandEyes (purchased separately) enables correlation of internet path, CDN and DNS telemetry with application performance, improving visibility into external dependencies and speeding issue resolution.
- Flexible deployment and data sovereignty: Splunk offers SaaS and self-managed options, including air-gapped support, allowing organizations to meet regulatory and data sovereignty requirements through local control of monitoring data.
- Sales execution: Splunk’s DEM offering comprises multiple products with differing pricing models, which, along with limited market visibility, may create confusion for prospective customers evaluating and purchasing the solution.
- Configuration complexity: Splunk’s DEM solution relies on CLI, API and declarative configuration for setup and management, with limited low-code or visual tools for synthetic or RUM configuration. This increases onboarding complexity for teams lacking strong scripting or DevOps skills.
- Product strategy: Following the integration of Splunk and AppDynamics, some advanced DEM features and enhancements are still rolling out across the portfolio. Depending on which product or deployment model they select, customers may encounter differences in capabilities or delayed availability.
Vendors Added and Dropped
We review and adjust our inclusion criteria for Magic Quadrants as markets change. As a result of these adjustments, the mix of vendors in any Magic Quadrant may change over time. A vendor's appearance in a Magic Quadrant one year and not the next does not necessarily indicate that we have changed our opinion of that vendor. It may be a reflection of a change in the market and, therefore, changed evaluation criteria, or of a change of focus by that vendor.
Added
- Checkly
- Conviva
Dropped
No vendors were dropped from this Magic Quadrant.
Inclusion and Exclusion Criteria
The inclusion criteria represent the specific attributes that analysts believe are necessary for inclusion in this research.
In addition to the following criteria, the vendor must rank among the top organizations using the Customer Interest Indicator (CII) defined by Gartner for this Magic Quadrant. CII is calculated using a weighted mix of internal and external inputs that reflect Gartner client interest, vendor customer engagement and client sentiment.
To qualify for inclusion, providers must meet all four of the market participation inclusion criteria.
Market Participation Inclusion Criteria:
- Provide generally available capabilities as of 16 June 2025. General availability means the product or service is widely available to all customers for purchase through normal sales channels.
- Sell the DEM tool directly to paying customers without requiring them to engage professional services help. The vendor must provide at least first-line support for these capabilities, including any bundled open-source software. This includes but is not limited to comprehensive product documentation, installation guidance and reference examples.
- Demonstrate an active product roadmap, and go-to-market and selling strategy for their DEM solution.
- Have phone, email and/or web customer support. Vendors must offer contract, console/portal, technical documentation and customer support in English (either as the product’s default language or as an optional localization).
Functionality Inclusion Criteria:
- The DEM tool must offer all mandatory and three of the five common features described in Gartner’s market definition.
- The DEM tool must be delivered via SaaS. Vendors may also provide self-hosted alternatives for clients that require them, but the self-hosted options are outside the scope of this research.
Performance Threshold Achievement:
- The DEM tool must have at least 50 paying, production (non-beta-test) customers in at least two geographic regions (Asia/Pacific, EMEA, Latin America or North America) excluding sales to managed service providers (MSPs), or
- The DEM tool must have generated at least $5 million in annual generally accepted accounting principles (GAAP) revenue during the 12 calendar months prior to June 2025.
Evaluation Criteria
Ability to Execute
Ability to Execute Evaluation Criteria
| Evaluation Criteria | Weighting |
|---|---|
Product or Service | High |
Overall Viability | Low |
Sales Execution/Pricing | High |
Market Responsiveness/Record | Medium |
Marketing Execution | Medium |
Customer Experience | Medium |
Operations | NotRated |
Source: Gartner (October 2025)
Completeness of Vision
Gartner analysts evaluate vendors on their ability to understand current market opportunities to create and articulate their vision for future market direction, innovation, customer requirements, and competitive forces. Ultimately, vendors are rated on their vision for the future and how well that maps to Gartner’s position.
General evaluation criteria are available at the end of this research. For this market, assessments were primarily based on:
- Market Understanding: This criterion considers a vendor’s ability to understand customer needs and translate them into products. Vendors that show a clear vision of their market listen, understand customer demands, and can shape or enhance market changes with their added vision. Consideration is given to understanding the rapidly evolving landscape around service performance.
- Marketing Strategy: This criterion looks for clear, differentiated messaging consistently communicated internally and externalized through social media, advertising, customer programs, and positioning statements. Consideration is given to new market outreach, innovative marketing initiatives, and true differentiation.
- Sales Strategy: This criterion considers whether the vendor has a sound strategy for selling that uses the appropriate networks, including direct and indirect sales, marketing, service, communication, and partners that extend the scope and depth of market reach, expertise, technologies, and the vendor’s customer base. Consideration is given to channel strategy and understanding the buyers and influencers involved in selection of observability platform products.
- Offering (Product) Strategy: This criterion evaluates whether a vendor’s approach to product development and delivery emphasizes market differentiation, functionality, methodology, and features that cover current and future requirements. Consideration is given to quality and cadence of a vendor’s product roadmap and investment priorities into adjacent market segments.
- Business Model: This criterion looks at the design, logic and execution of the vendor’s business proposition to achieve continued success. Consideration is given to vendors’ business, value proposition, ability to anticipate shifts in licensing/pricing models, and relationships with open-source communities.
- Vertical/Industry Strategy: As observability platforms tend not to be industry-specific, evaluating these in detail is not a key element of this research. Where vertical or industry differentiation is relevant, questions are included in other criteria categories.
- Innovation: This criterion looks at direct, related, complementary, and synergistic layouts of resources, and expertise or capital for investment, consolidation, defensive or preemptive purposes. Consideration is given to the level of investment in product development in new areas related or adjacent to observability, third-party and partner relationships and integrations, and the use of AI/ML and other novel capabilities.
- Geographic Strategy: This criterion evaluates the provider’s strategy to allocate resources, skills, and offerings to meet the needs of geographies outside its native region, either directly or through partners, channels, and subsidiaries. Additional consideration is given to employee distribution, SaaS platform locations, tailored go-to-market strategies, and the depth of regional partners for existing and new customers.
Completeness of Vision Evaluation Criteria
| Evaluation Criteria | Weighting |
|---|---|
Market Understanding | High |
Marketing Strategy | High |
Sales Strategy | Medium |
Offering (Product) Strategy | High |
Business Model | Low |
Vertical/Industry Strategy | NotRated |
Innovation | High |
Geographic Strategy | Low |
Source: Gartner (October 2025)
Quadrant Descriptions
Leaders
Leaders exhibit strong execution and vision scores and exemplify the functionality required for IT organizations to continuously evaluate and improve DEM. Leaders have the broadest set of capabilities, strongest roadmaps, and a larger installed base, and cover the most geographic regions and industries.
Challengers
Challengers exhibit a strong set of technologies, marketing and sales execution, and intellectual property — as also exhibited by Leaders — but do not have the requisite strategic support, vision, innovation, or roadmap to compete in the Leaders quadrant. Many Challengers tailor solutions to specific market segments or use cases.
Visionaries
Visionaries exhibit strong strategic support, vision, and innovation, and a robust roadmap but have not yet amassed the requisite size, installed base, platform breadth, or integration points to compete in the Leaders quadrant.
Niche Players
Niche Players exhibit a consistent ability to address specific use cases, geographic regions, market segments, or verticals. Their offerings, however, generally fail to provide a breadth of features and cannot scale to be relevant to all buyers.
Context
The goal of any Magic Quadrant is to provide a level view of comparable vendors (size, capability, and corporate structure) to address the demands of a wide variety of buyers. Not every company’s requirements are identical. We encourage clients to review the accompanying Critical Capabilities for Digital Experience Monitoring research for use case and functionality requirements, and this Magic Quadrant research to align industry expertise, vision, technology, and cost requirements with the right vendor, regardless of the vendor’s quadrant. Buyers should evaluate providers against specific outcome-driven requirements rather than expecting a fully capable end-to-end solution.
The digital experience monitoring market is at an important inflection point, transforming from a discipline of passive performance measurement into a strategic engine for proactive, business-aware operations. The true value of DEM is unlocked through integration with observability platforms and the application of AI to correlate user experience with tangible business KPIs like revenue and conversion. This shift demands a new approach from clients, where evaluation criteria must move beyond technical metrics to a vendor’s ability to provide AI-driven business insights.
Clients must also navigate a landscape of aggressive marketing and market consolidation. It is crucial to scrutinize vendor claims of “agentic AI,” as a significant “reality gap” exists between marketing promises and the current assistive capabilities of most tools. Demanding proof of true, multistep automation during evaluations is essential to avoid overpaying for hyped features. Furthermore, with increasing M&A activity in the wider observability markets, a thorough assessment of a vendor’s long-term viability and strategic direction is a critical risk mitigation step before making a long-term investment in a DEM solution.
Market Overview
Customers access modern applications through a diverse array of channels, from browsers and mobile apps to APIs and traditional desktop software. The ability to monitor and optimize the end-user experience across these digital platforms is a critical aspect of modern IT operations, now fundamentally supercharged by artificial intelligence.
AI and machine learning are key to the future of DEM, automating the analysis of user experiences to predict user behavior, proactively identify issues before they cause impact, and provide actionable insights for improvement. This allows organizations to move beyond simply tracking customer activity and web application performance. Instead, they can use AI-powered insights to optimize the customer journey, enhance satisfaction, and boost conversion rates, turning performance data into a strategic business asset.
However, as organizations seek to gain insight into their customers’ activities and habits, privacy continues to be a concern for vendors, clients, and regulators. Real user monitoring has access to sensitive personal information. IT leaders in charge of such sensitive data must ensure that any DEM offering includes as core functionalities the ability to mask, anonymize, and aggregate data. Innovations in this area include using AI for pattern recognition to identify sensitive data rather than relying solely on human operator identification.
The DEM market grew by 17.1% in 2024 (see Market Share Analysis: ITOM, Health and Performance Analysis Software, Worldwide, 2024) and is projected to grow by 14.3% compound annual growth rate (CAGR) through 2028 in constant currency.
Growth in the digital experience monitoring market continues to be propelled by foundational enterprise shifts. These include digital business transformation, the importance of user experience, and the proliferation of externally hosted and SaaS-based applications that limit traditional IT insight and control. In this complex environment, DEM provides a critical user-centric lens that measures performance directly from the end-user’s perspective. This ensures these vital applications and their underlying services maintain high availability and optimal performance. The market’s future is now being shaped by AI and machine learning, which are key to automating the analysis of user journeys, proactively identifying potential issues before they impact users, and delivering the actionable insights necessary to continuously improve the digital experience.
Customer Interest Index (CII): Gartner’s CII used for this Magic Quadrant calculates and ranks included vendors using a balanced set of measures that include, but are not limited to:
- Gartner client interaction and Gartner.com search volume and trend data.
- Customer interest and engagement as represented by various social media and other platform engagement measurements.
Social media analytics: Gartner conducts social listening analysis leveraging third-party data tools to complement or supplement the other fact bases presented in this document. Due to its qualitative and organic nature, the results should not be used separately from the rest of this research. No conclusions should be drawn from this data alone. Social media data in reference is from in all geographies (except China) and recognized languages. Social media analytics study results do not represent global findings or the market as a whole but reflect the aggregate crowdsourced opinion of the respondents commenting about the topic on social media.
Ability to Execute
Product/Service: Core goods and services offered by the vendor for the defined market. This includes current product/service capabilities, quality, feature sets, skills and so on, whether offered natively or through OEM agreements/partnerships as defined in the market definition and detailed in the subcriteria.
Overall Viability: Viability includes an assessment of the overall organization's financial health, the financial and practical success of the business unit, and the likelihood that the individual business unit will continue investing in the product, will continue offering the product and will advance the state of the art within the organization's portfolio of products.
Sales Execution/Pricing: The vendor's capabilities in all presales activities and the structure that supports them. This includes deal management, pricing and negotiation, presales support, and the overall effectiveness of the sales channel.
Market Responsiveness/Record: Ability to respond, change direction, be flexible and achieve competitive success as opportunities develop, competitors act, customer needs evolve and market dynamics change. This criterion also considers the vendor's history of responsiveness.
Marketing Execution: The clarity, quality, creativity and efficacy of programs designed to deliver the organization's message to influence the market, promote the brand and business, increase awareness of the products, and establish a positive identification with the product/brand and organization in the minds of buyers. This "mind share" can be driven by a combination of publicity, promotional initiatives, thought leadership, word of mouth and sales activities.
Customer Experience: Relationships, products and services/programs that enable clients to be successful with the products evaluated. Specifically, this includes the ways customers receive technical support or account support. This can also include ancillary tools, customer support programs (and the quality thereof), availability of user groups, service-level agreements and so on.
Operations: The ability of the organization to meet its goals and commitments. Factors include the quality of the organizational structure, including skills, experiences, programs, systems and other vehicles that enable the organization to operate effectively and efficiently on an ongoing basis.
Completeness of Vision
Market Understanding: Ability of the vendor to understand buyers' wants and needs and to translate those into products and services. Vendors that show the highest degree of vision listen to and understand buyers' wants and needs, and can shape or enhance those with their added vision.
Marketing Strategy: A clear, differentiated set of messages consistently communicated throughout the organization and externalized through the website, advertising, customer programs and positioning statements.
Sales Strategy: The strategy for selling products that uses the appropriate network of direct and indirect sales, marketing, service, and communication affiliates that extend the scope and depth of market reach, skills, expertise, technologies, services and the customer base.
Offering (Product) Strategy: The vendor's approach to product development and delivery that emphasizes differentiation, functionality, methodology and feature sets as they map to current and future requirements.
Business Model: The soundness and logic of the vendor's underlying business proposition.
Vertical/Industry Strategy: The vendor's strategy to direct resources, skills and offerings to meet the specific needs of individual market segments, including vertical markets.
Innovation: Direct, related, complementary and synergistic layouts of resources, expertise or capital for investment, consolidation, defensive or pre-emptive purposes.
Geographic Strategy: The vendor's strategy to direct resources, skills and offerings to meet the specific needs of geographies outside the "home" or native geography, either directly or through partners, channels and subsidiaries as appropriate for that geography and market.