Voice of the Customer for Privileged Access Management
15 April 2026 - ID G00850737 - 5 min read
By Peer Community Contributor
Compromised admin credentials remain the primary vector for ransomware, making immediate vaulting of high-risk accounts vital. This note guides identity and access management leaders to learn from ratings and reviews by their peers shared on Gartner Peer Insights.
To view the Interactive Voice of the Customer for this market, click the Launch button at the top of this page.
What Is Privileged Access Management?
Gartner defines privileged access management (PAM) as tools that provide an elevated level of technical access through the management and protection of accounts, credentials and commands, which are used to administer or configure systems and applications. PAM tools — available as software, SaaS or hardware appliances — manage privileged access for both people (system administrators and others) and machines (systems or applications). Gartner defines five distinct tool categories for PAM tools:
- Privileged account and session management (PASM)
- Privilege elevation and delegation management (PEDM)
- Secrets management
- Cloud infrastructure entitlement management (CIEM)
- Remote PAM (RPAM)
Privileged access is access beyond the normal level granted to both human and machine accounts. It allows users to override existing access controls, change security configurations, or make changes affecting multiple users or systems. As privileged access can create, modify and delete IT infrastructure, along with company data contained in that infrastructure, it presents catastrophic risk. Managing privileged access is thus a critical security function for every organization and requires a specific set of procedures and tools. PAM tools focus on either privileged accounts or privileged commands.
What Is Gartner Peer Insights “Voice of the Customer”?
“Voice of the Customer” synthesizes Gartner Peer Insights reviews into insights for buyers of technology and services. This aggregated peer perspective, along with the individual detailed reviews, is complementary to Gartner’s expert research and can play a key role in your buying process. Peers are verified reviewers of a technology product or service, who not only rate the offering, but also provide valuable feedback to consider before making a purchase decision. You can read individual reviews and ratings on the Gartner Peer Insights page for this market.
Along with the historical peer-based perspective represented in this document, Gartner has a related expert-led Magic Quadrant for Privileged Access Management.
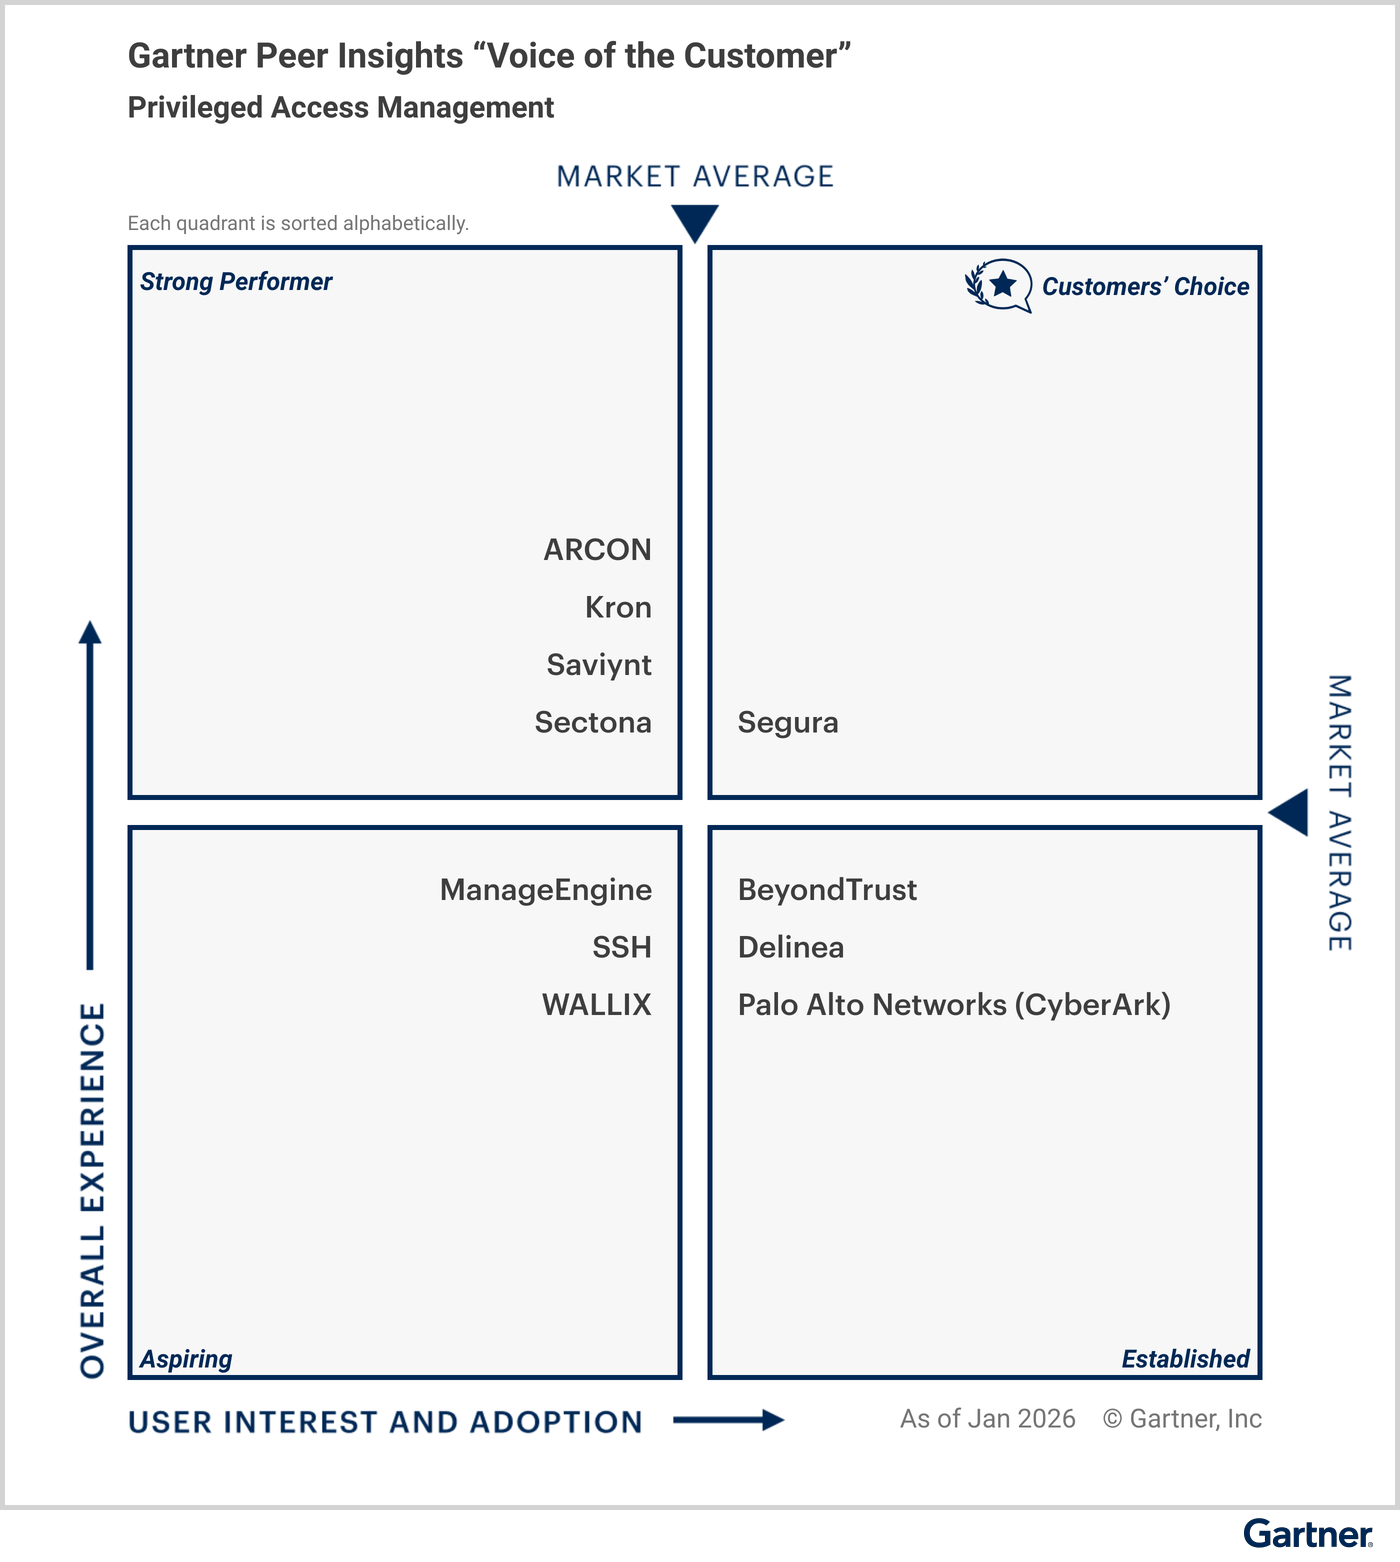
Figure 1 shows all “Voice of the Customer” eligible vendors in the market categorized into four quadrants based on scores assigned for User Interest and Adoption (x-axis), and Overall Experience (y-axis). The midpoint of each axis, labeled “market average,” represents the average score as calculated exclusively from vendors included in the document. See Gartner Peer Insights Voice of the Customer Methodology for details.
Privileged Access Management Willingness to Recommend
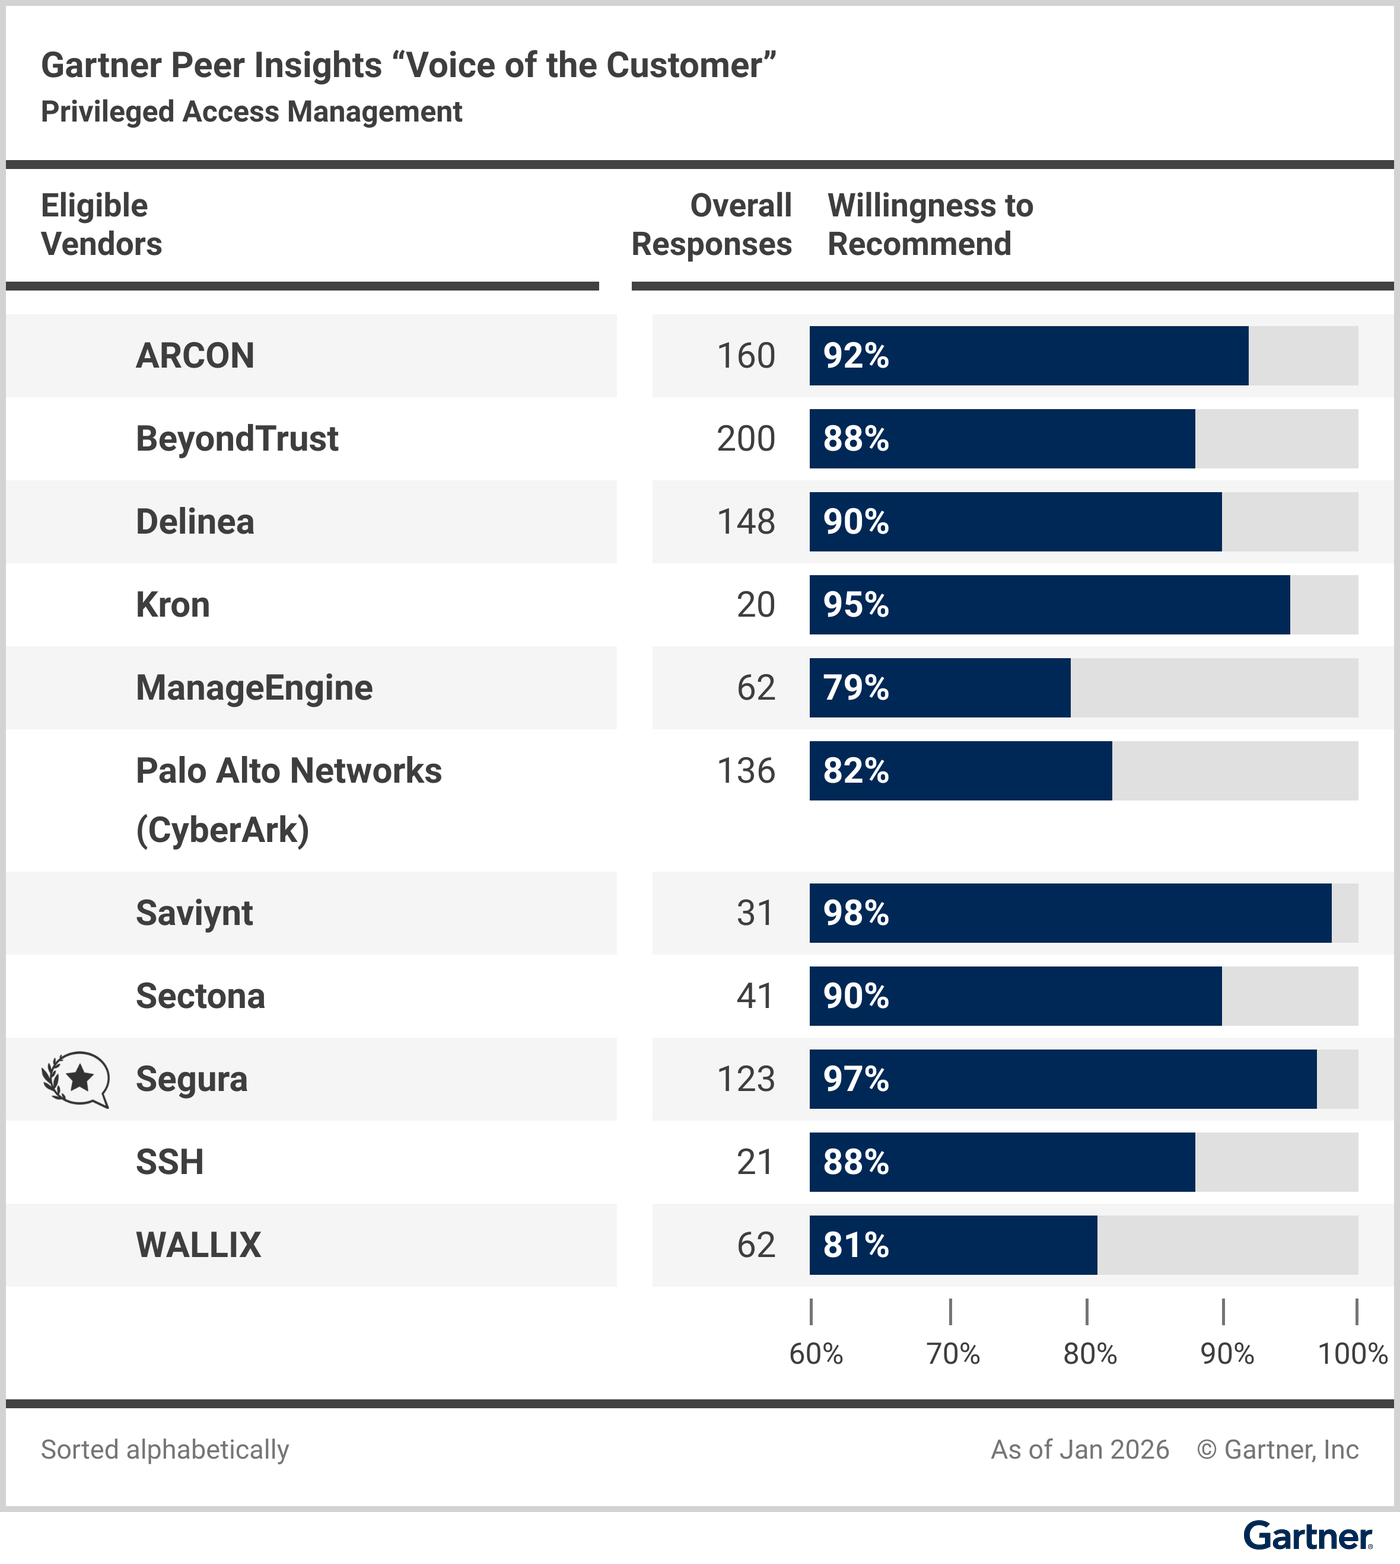
Gartner Peer Insights reviewers rate their willingness to recommend each vendor. Figure 2 compares vendors according to the reviewers’ willingness to recommend them. See Gartner Peer Insights Voice of the Customer Methodology for details.
Vendor Summaries
Figures 3 through 13 summarize key information for each vendor included in the “Voice of the Customer”:
- Reviewer demographics for reviews received in the 18-month review period, ending 31 January 2026
- Overall Rating and rating distribution
- Other ratings covering specific aspects of the experience with the vendor
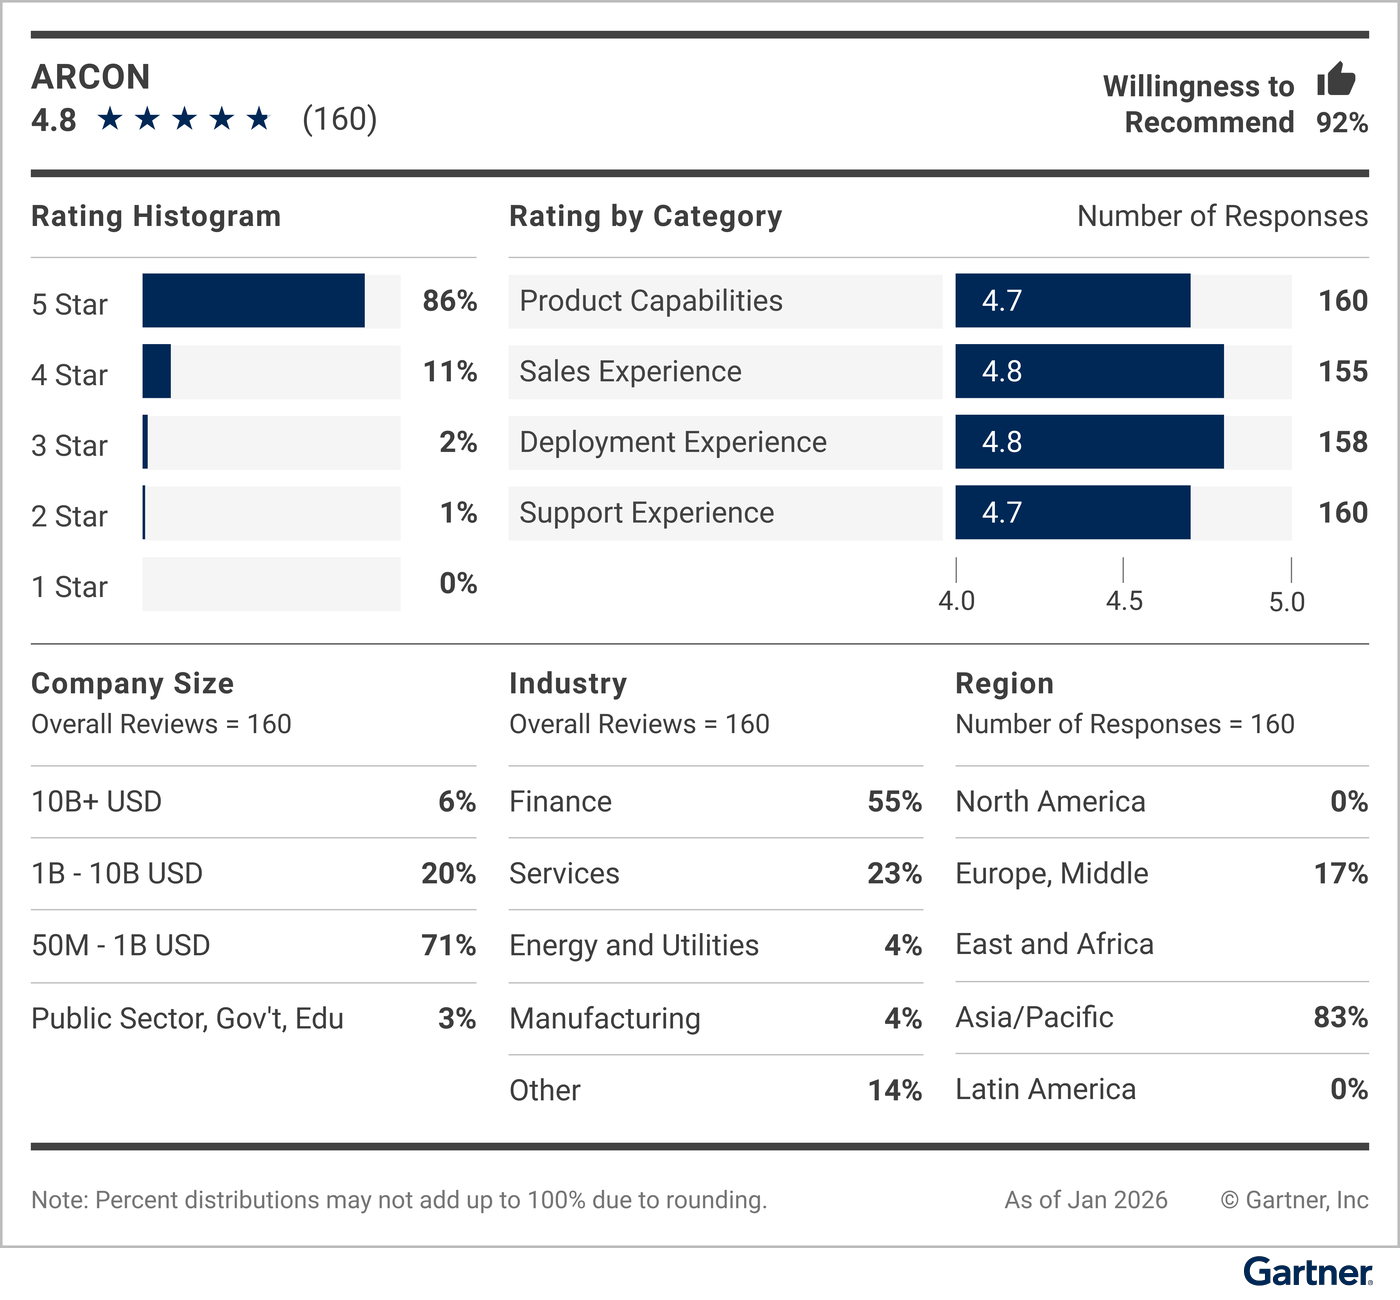
Read all Peer Insights user reviews for ARCON.
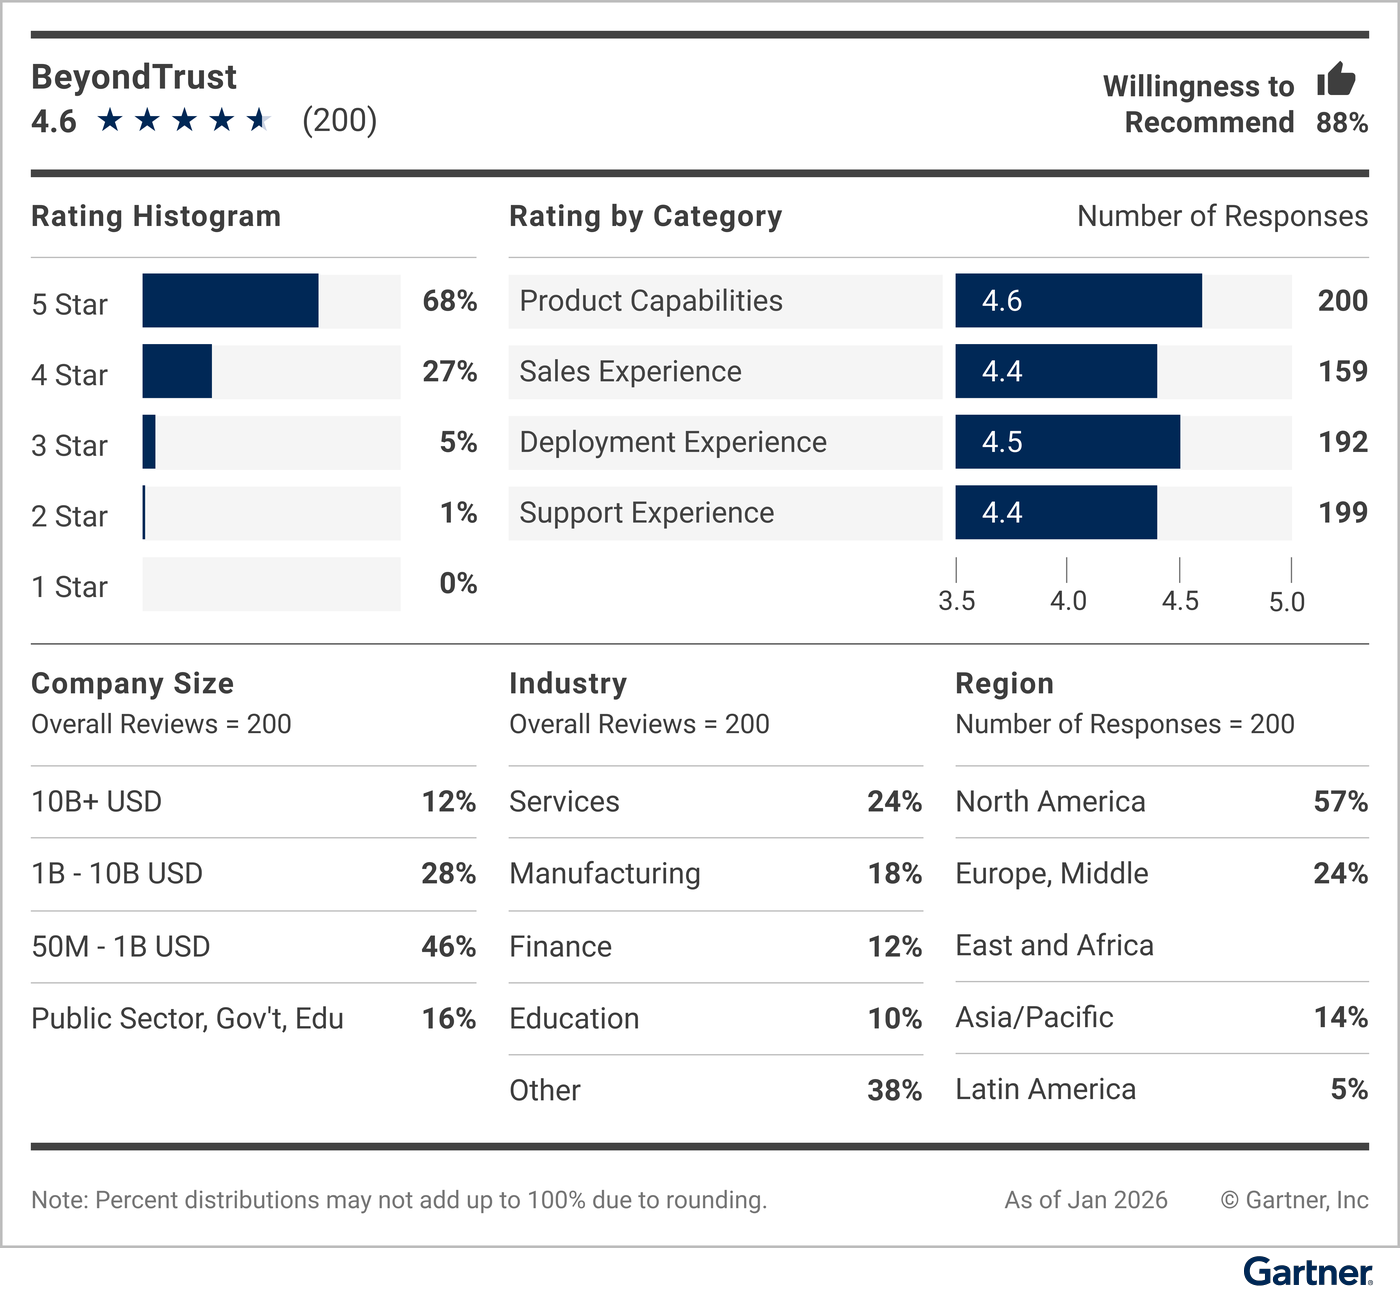
Read all Peer Insights user reviews for BeyondTrust.
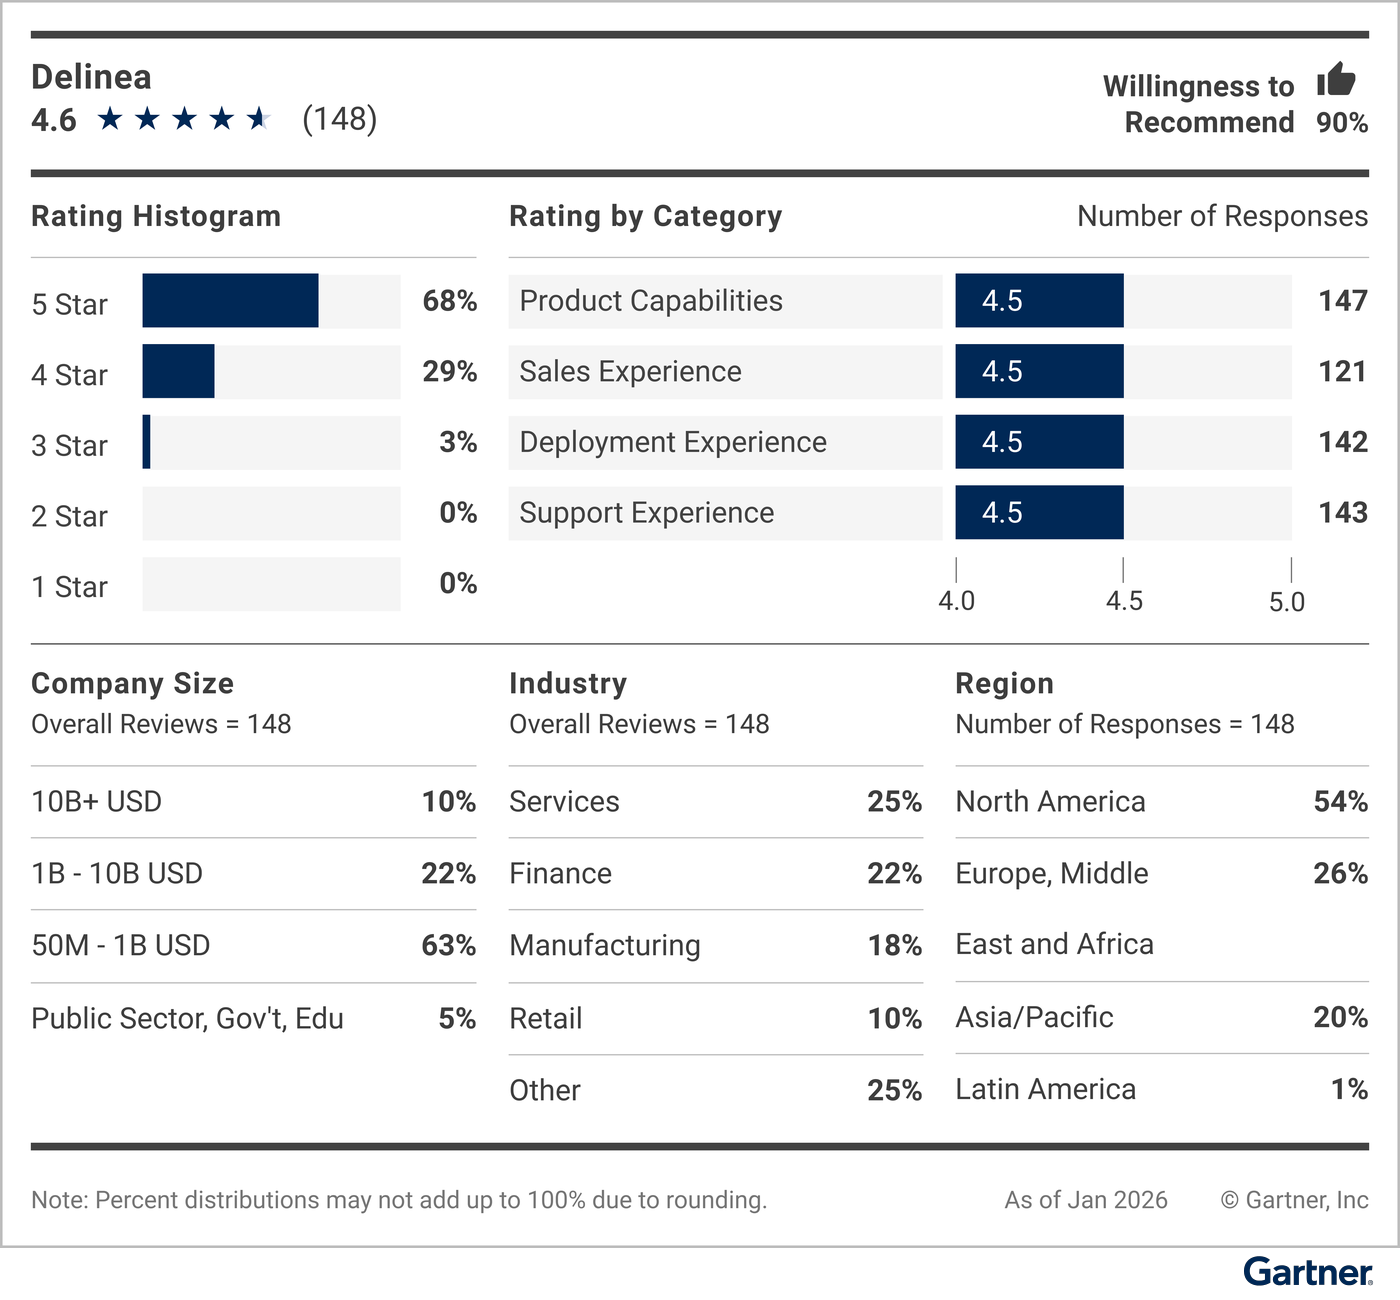
Read all Peer Insights user reviews for Delinea.
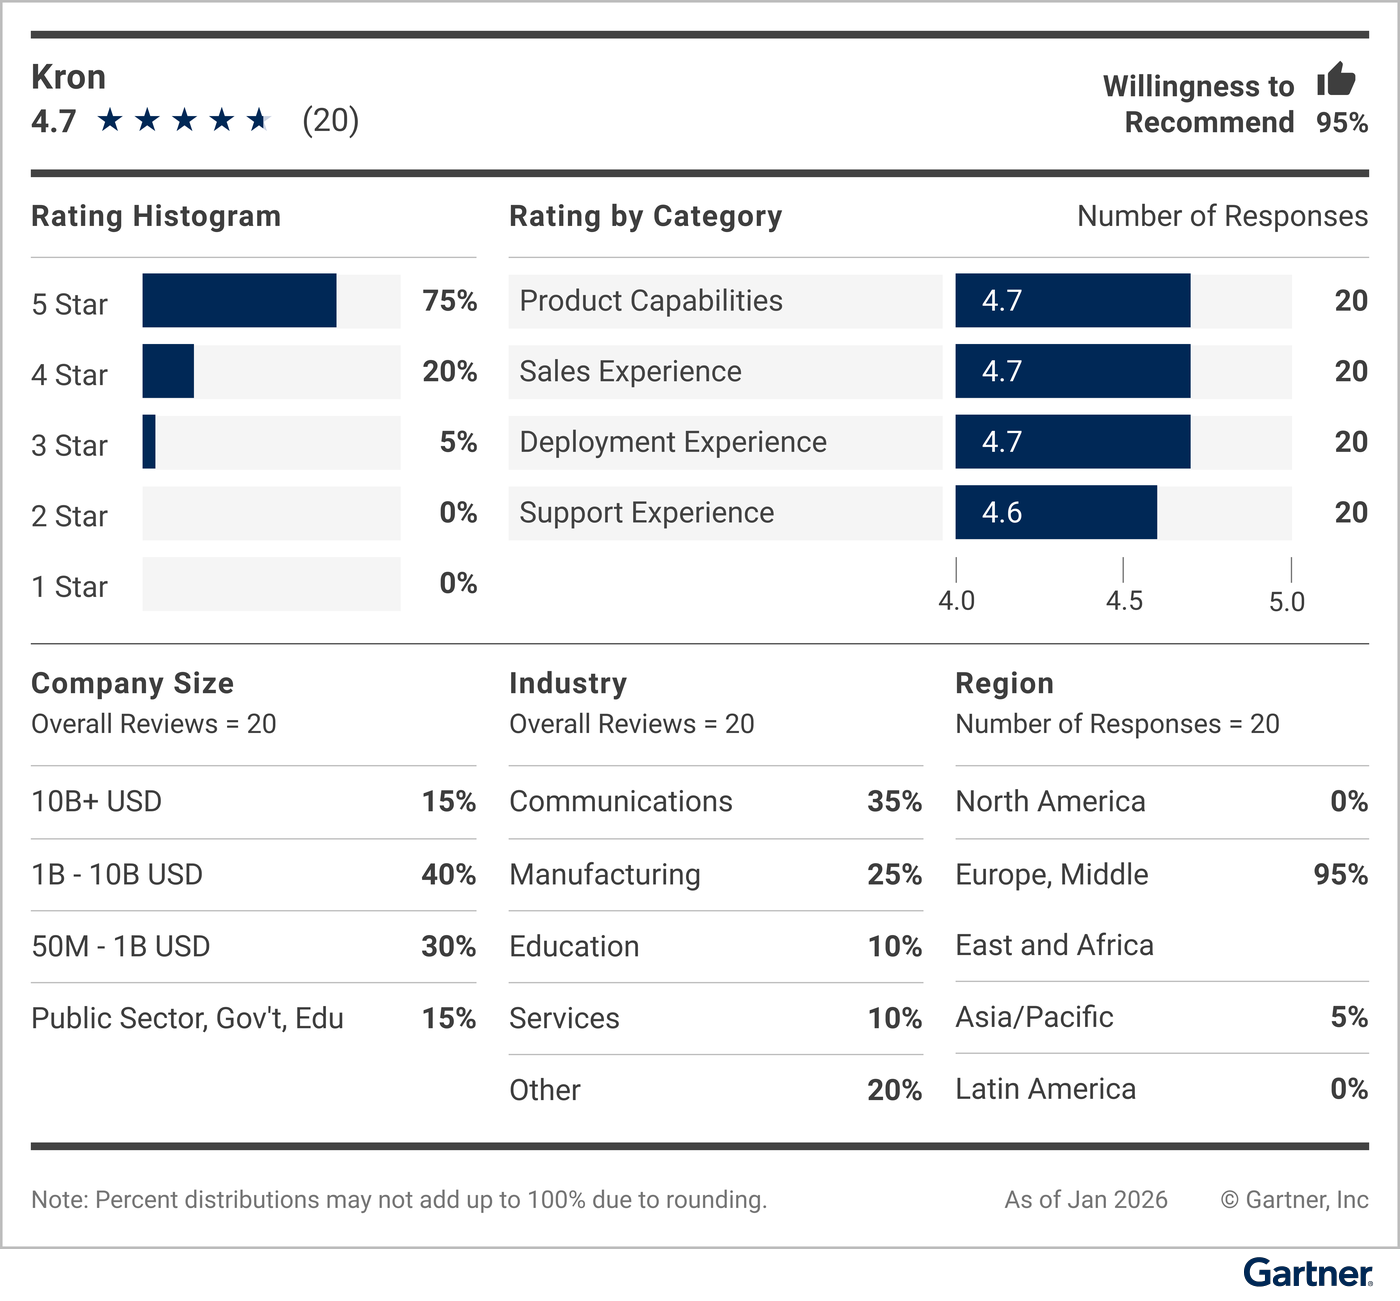
Read all Peer Insights user reviews for Kron.
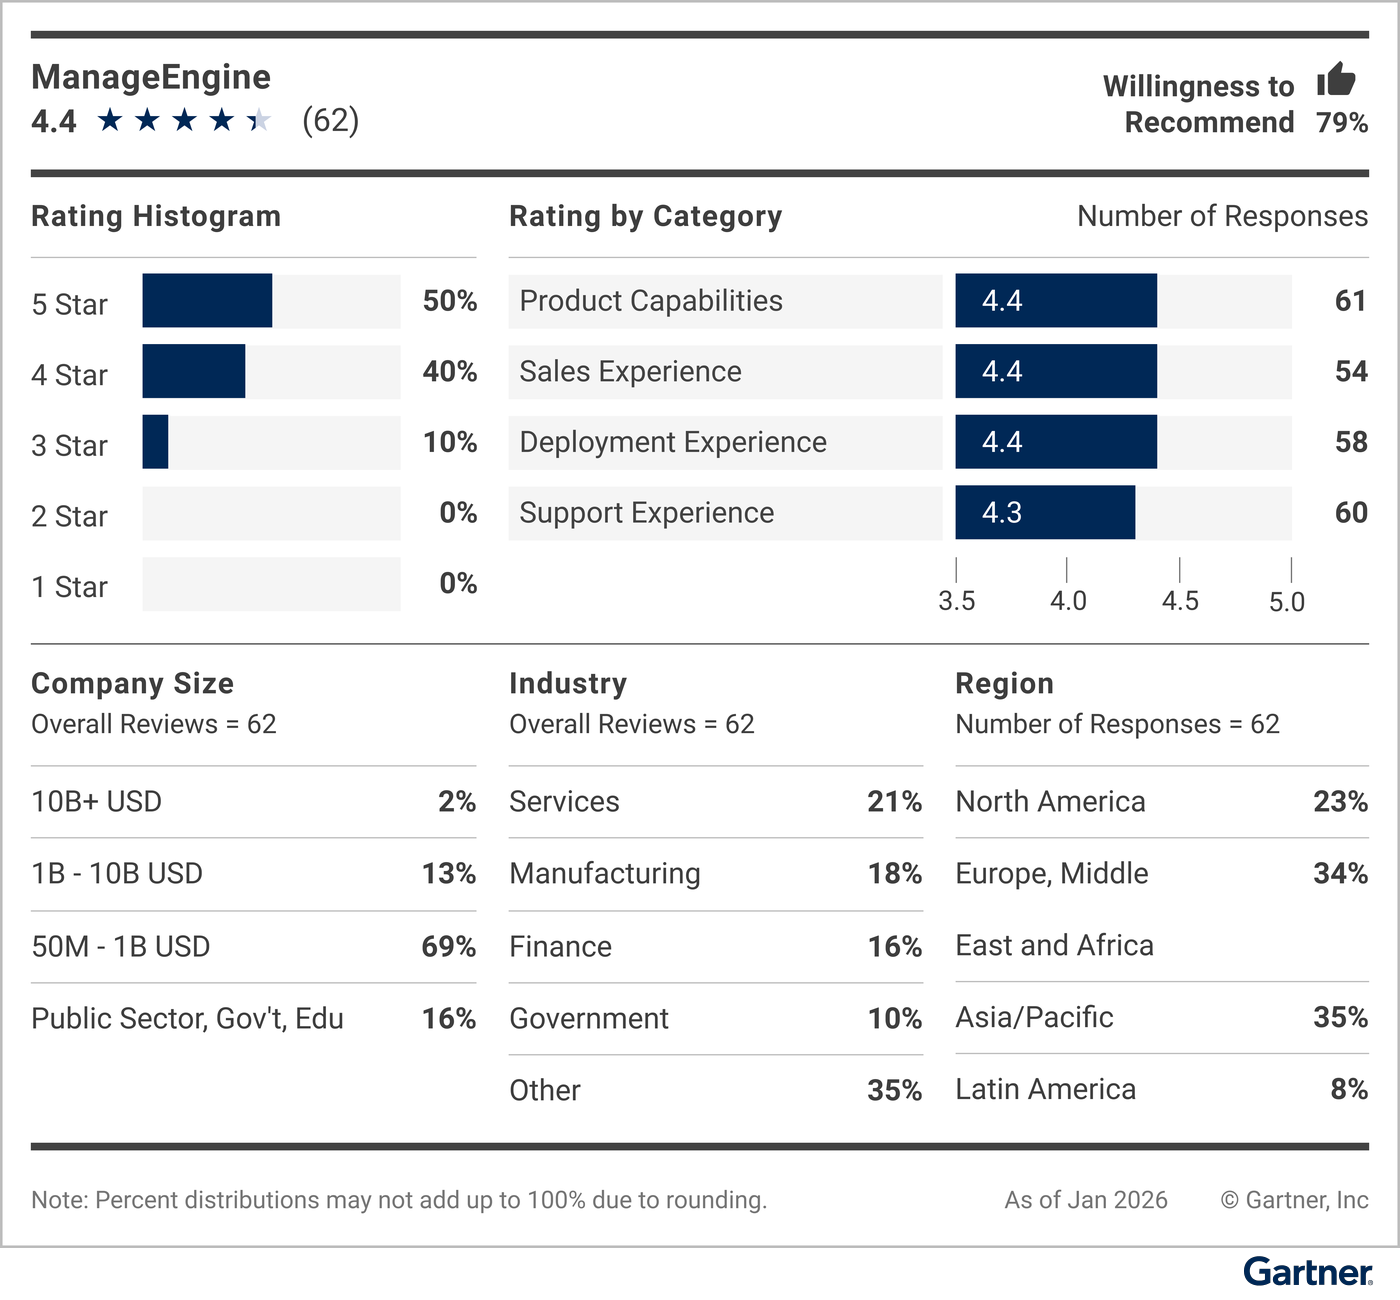
Read all Peer Insights user reviews for ManageEngine.
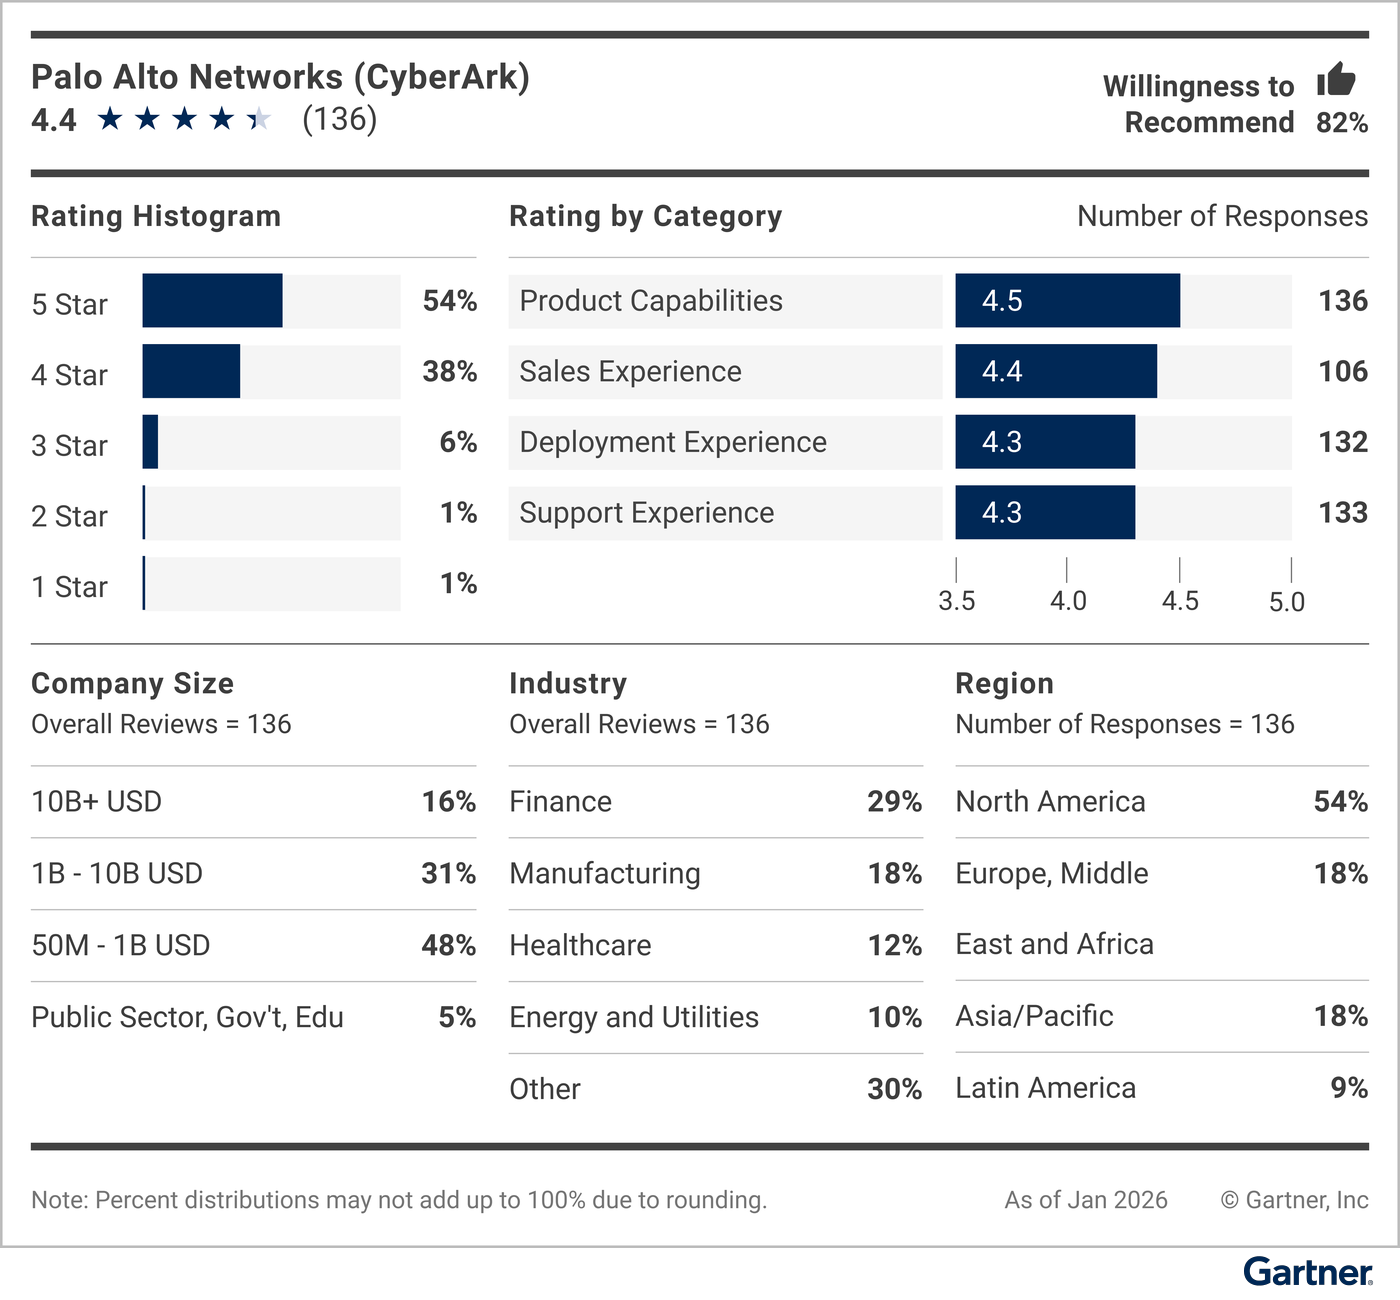
Read all Peer Insights user reviews for Palo Alto Networks (CyberArk).
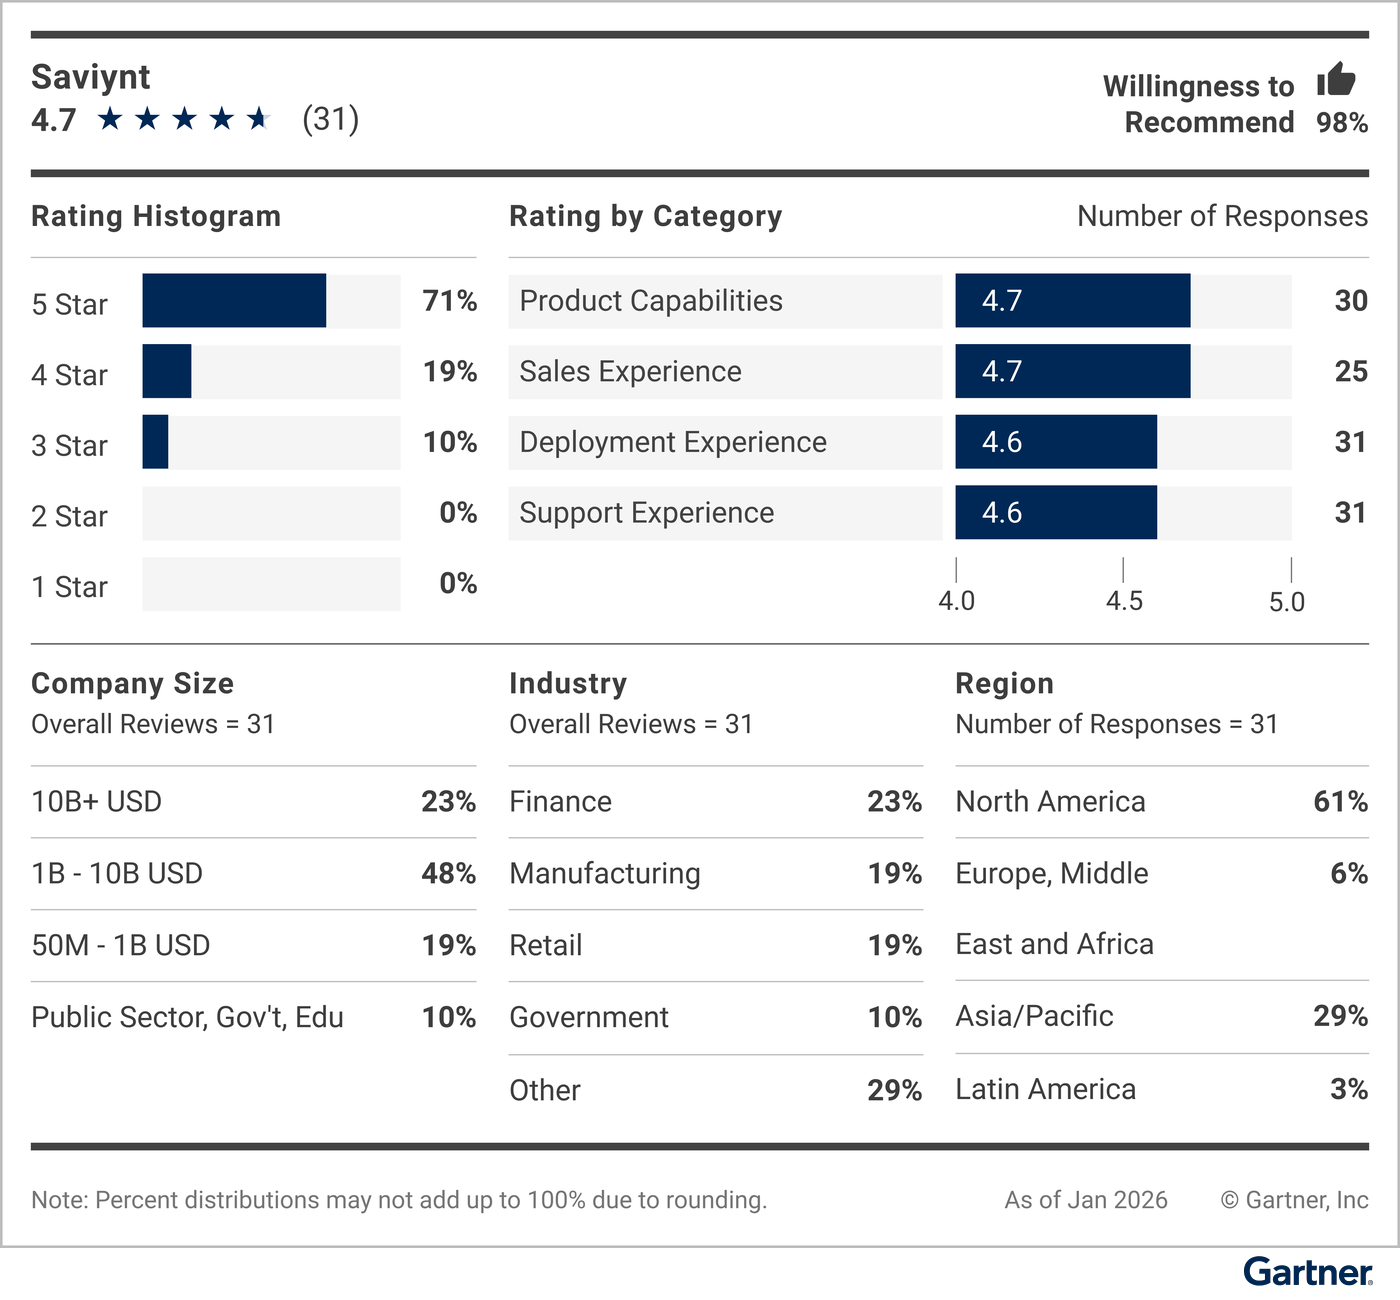
Read all Peer Insights user reviews for Saviynt.
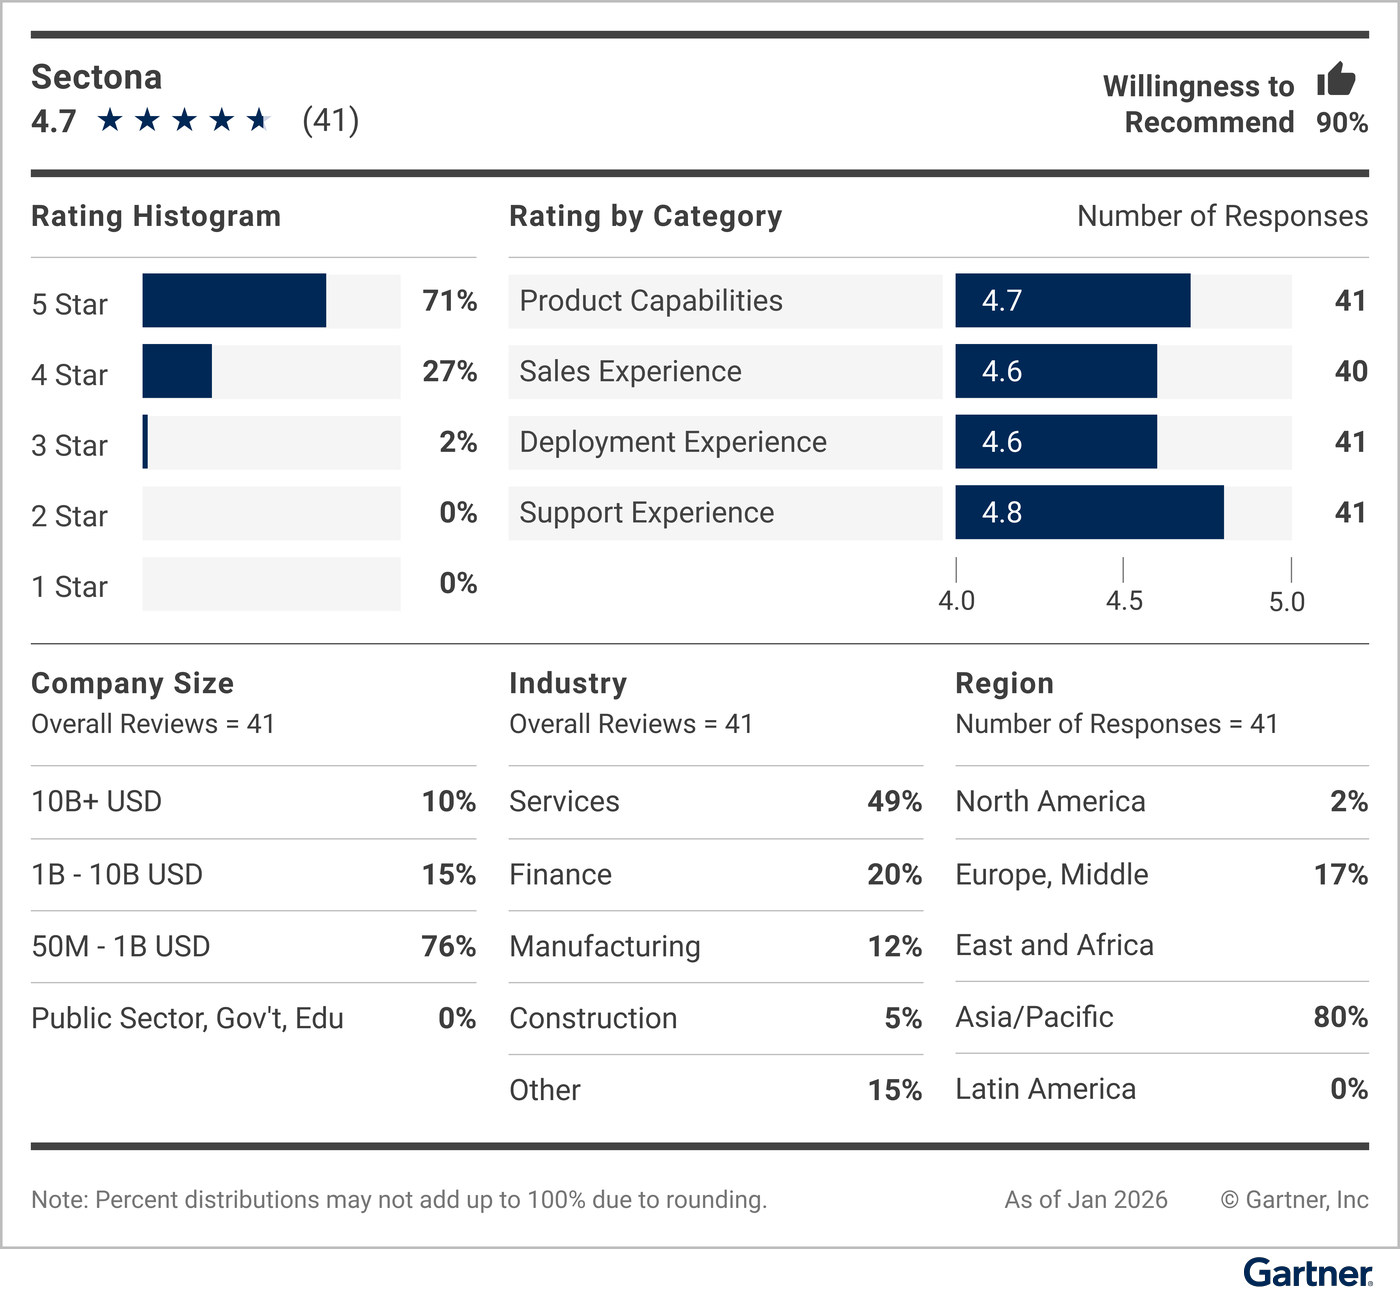
Read all Peer Insights user reviews for Sectona.
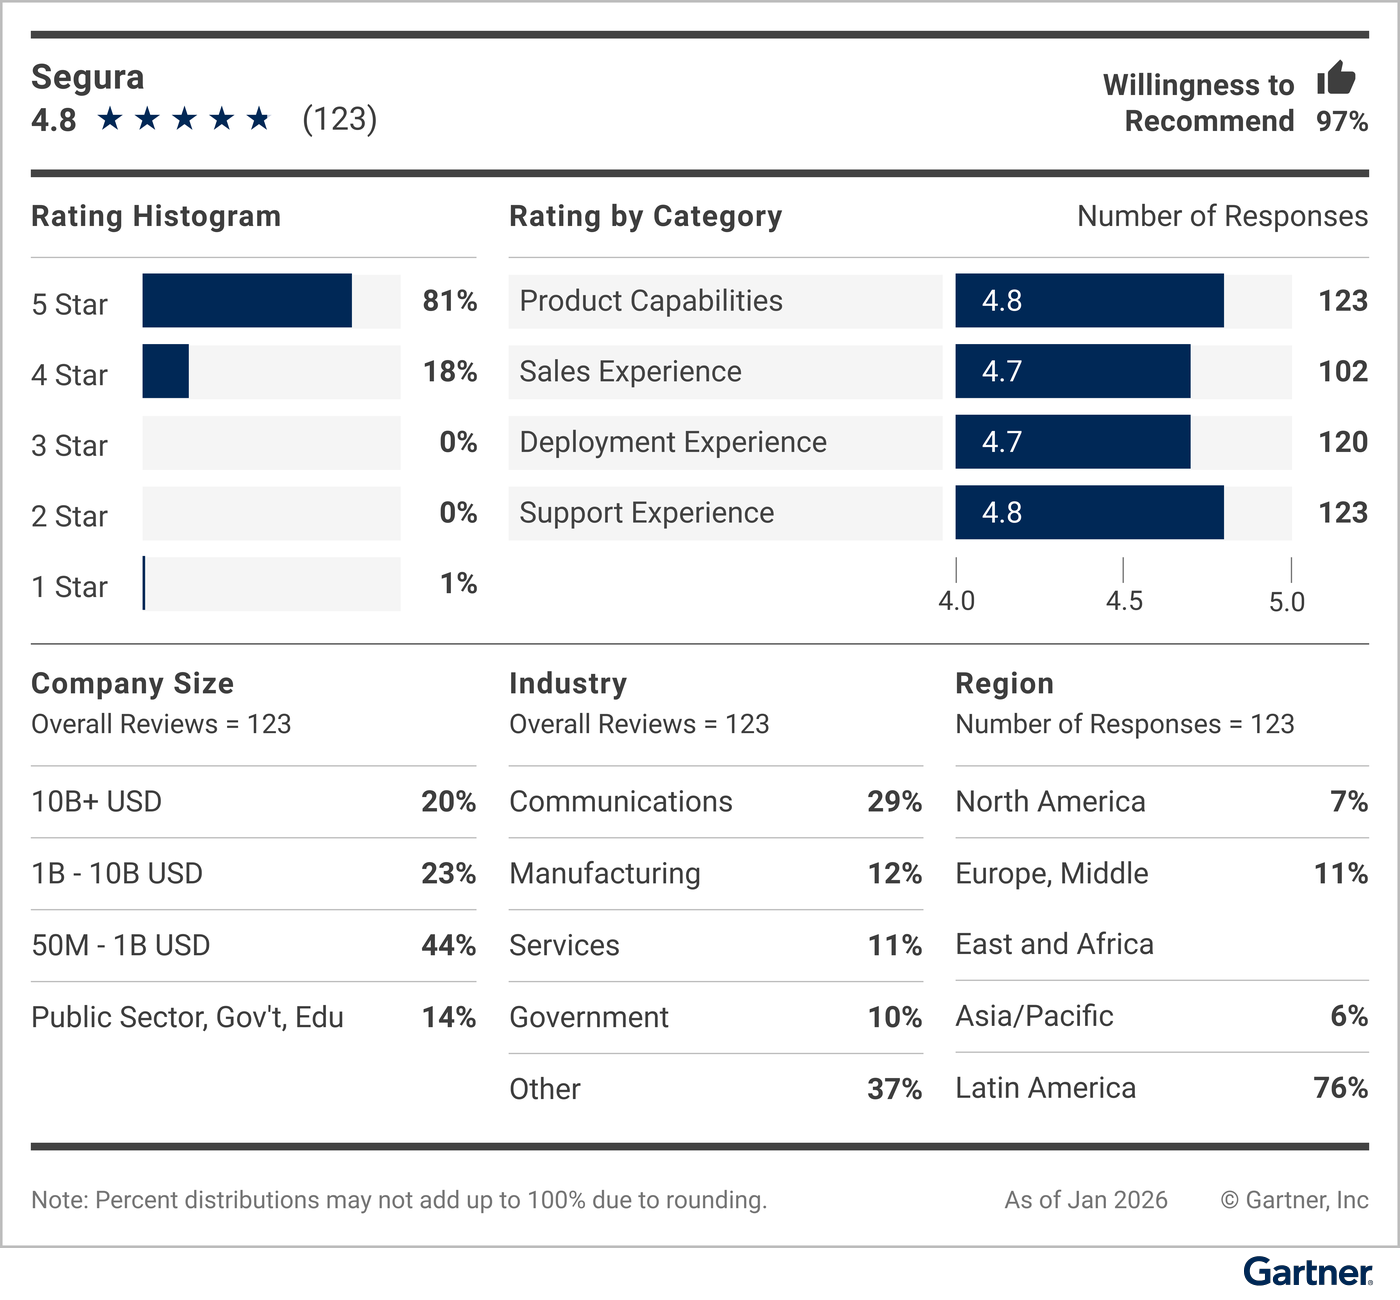
Read all Peer Insights user reviews for Segura.
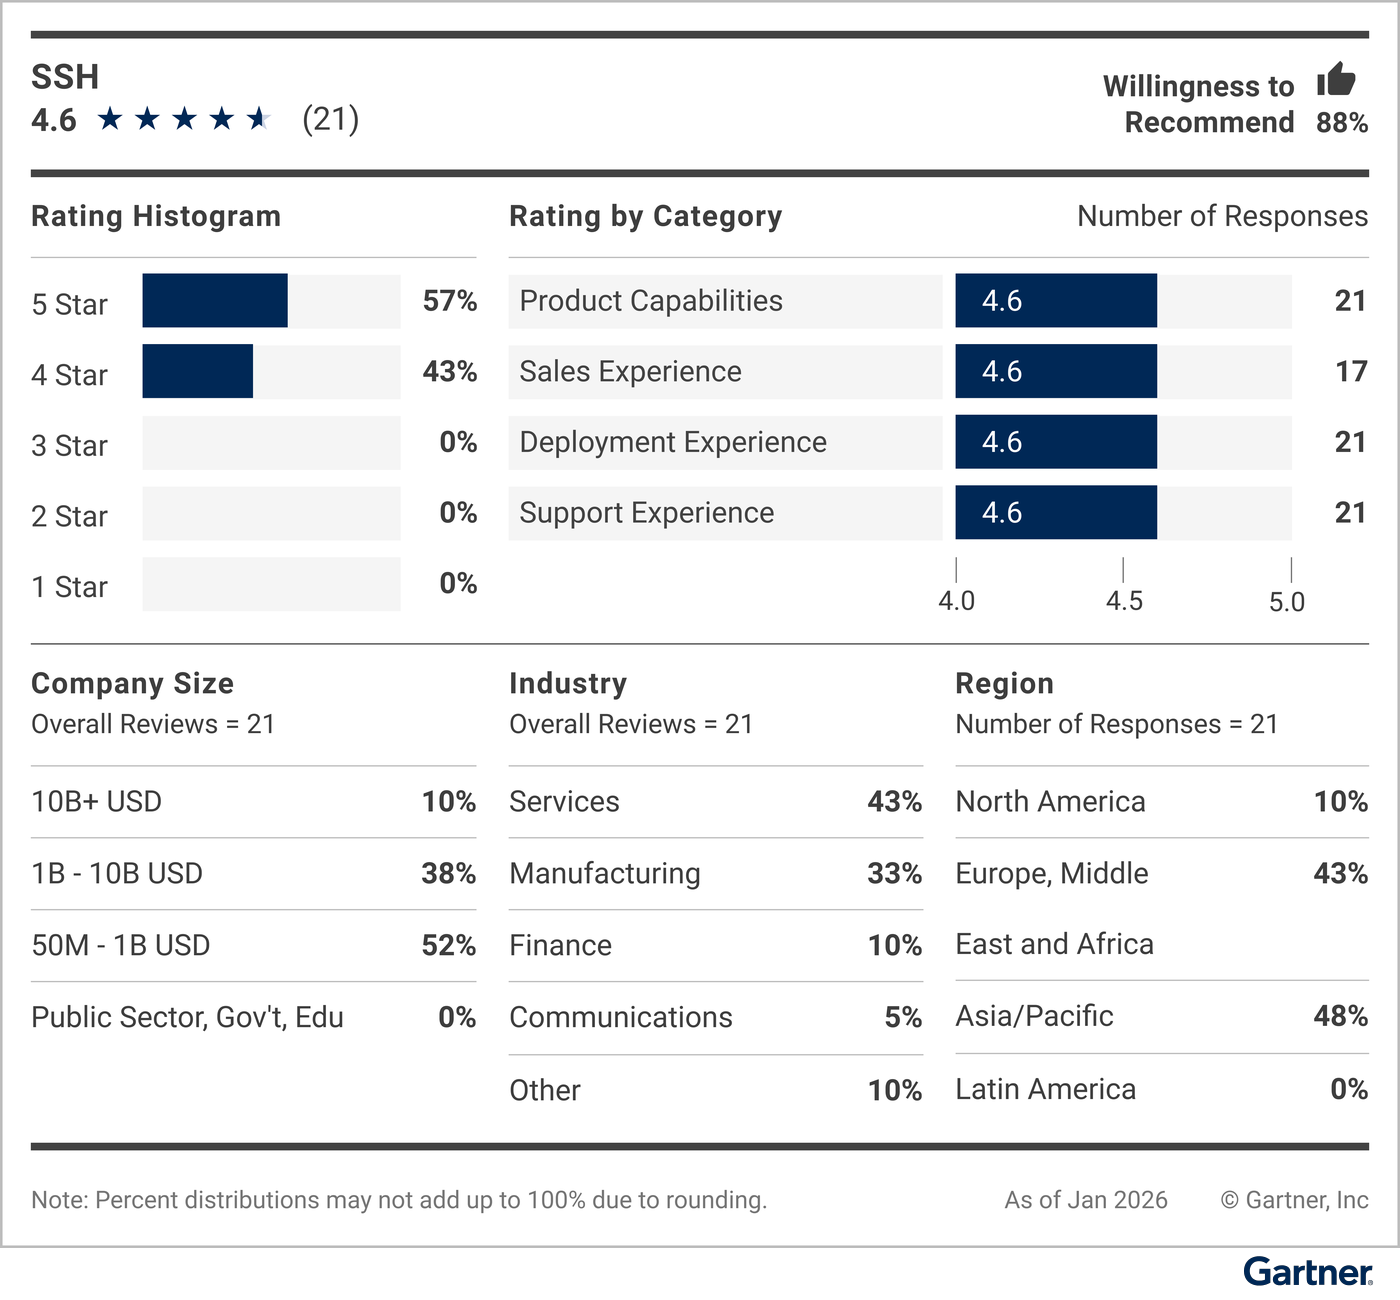
Read all Peer Insights user reviews for SSH.
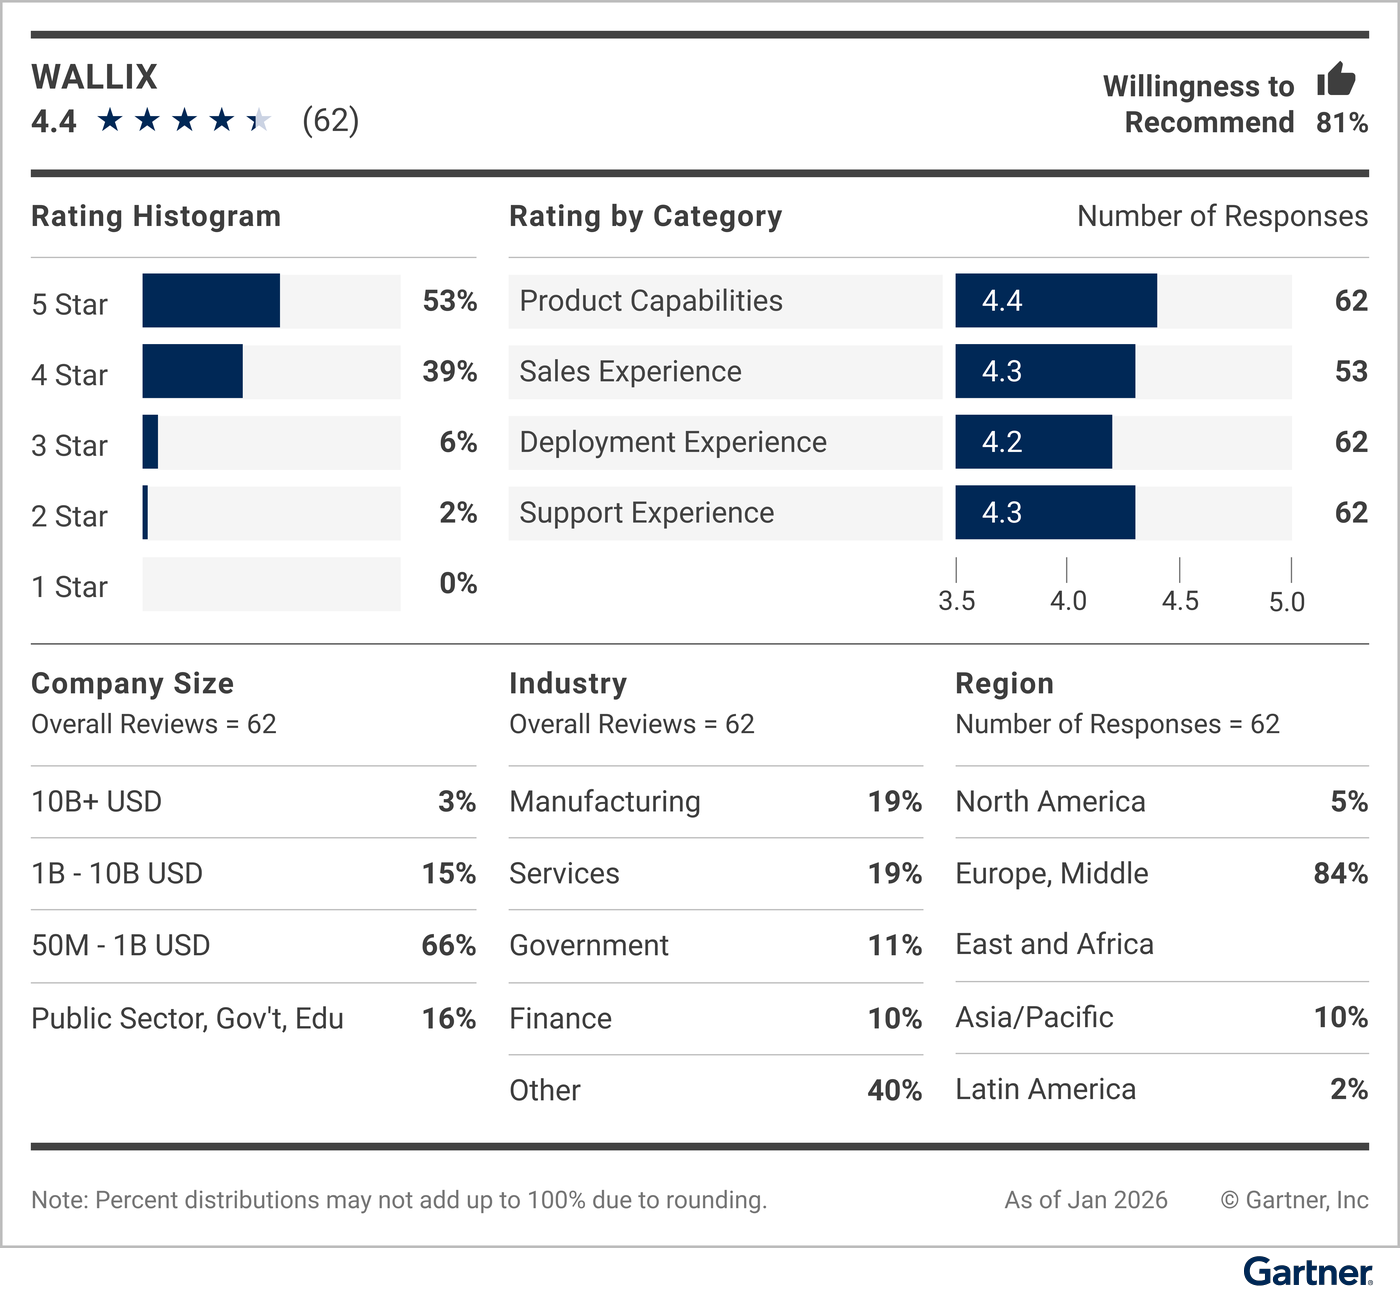
Read all Peer Insights user reviews for WALLIX.
Methodology
A full description of the methodology can be found on the Gartner Peer Insights Voice of the Customer Methodology page.
Voice of the Customer includes vendors with products aligned to the market that have 20 or more eligible published reviews (and 15 or more ratings for “Capabilities” and “Support/Delivery”) during the 18-month consideration period ending 31 January 2026. Reviews from vendor partners or companies with less than $50 million in revenue are excluded.
In the privileged access management market, Gartner Peer Insights published 1,502 reviews and ratings during the consideration period.
The data used in this report is drawn from reviews on Peer Insights, a free peer review and ratings platform that regularly publishes new reviews. The Voice of the Customer methodology uses a snapshot of reviews data from a defined time frame and does not automatically update as new reviews are published. The external Peer Insights site will always have the most updated peer view of the vendors and products in this report.
The numerical ratings scores in each vendor summary graphic (shown as “Rating by Category”) are best interpreted as sample statistics with a reasonable margin for error and not as exact values.