
How to Implement a Modern Business Intelligence and Analytics Platforme
A modern BI and analytics platforms that is easy to implement and operate is not enough to guarantee success. Data and analytics leaders must offer the right platform capabilities, roles, processes and integration with existing BI environments to meet user expectations.
Key Findings
- Most of the modern BI and analytics platforms available in the market today are easy to set up, administer and work with, but that alone does not guarantee successful data exploration.
- The modern BI and analytics platforms can be deployed with disparate capabilities and follow different architecture models, leading to different business outcomes.
- Some organizations deploy modern BI and analytics platforms that offer the wrong set of capabilities to business users, or are used as analytics silos, with no governance or proper integration with the overall BI landscape, which leads to poor results.
- While most vendors are growing their capabilities and expanding their footprints from the information portal to the data science laboratory, there are still gaps that can't be solved by a single tool, leading to problems with solution design and integration pains.
Recommendations
- Embrace all aspects of the implementation challenge – including platform capabilities, and integration touchpoints with existing BI and analytics platforms, roles and processes.
- Build a holistic modern BI and analytics platform gradually – spanning from the information portal to the data science laboratory to create an analytics continuum, with time to grow and consolidate skills and processes.
- Prepare to follow a portfolio approach and integrate components from different vendors, identifying and deploying tools that can mesh with each other.
- Make the complementary investments in information management and governance that will act as a backbone for the modern BI platform.
- Create a BI and analytics center of excellence to ensure successful deployment, establish proper governance models, and support the adoption of the required roles and processes.
Strategic Planning Assumption
By 2018, a third of modern BI and analytics platform implementations will fail to meet user expectations due to poor design, lack of governance or improper integration within the overall BI landscape.
Introduction
This is one of two research notes that help data and analytics leaders select and implement an architecture model for the modern BI and analytics platform. Readers should refer first to "Select the Right Architecture Model for Your Modern BI and Analytics Platform."
In this document, you will find details of the platform components for the three scenarios described in the first note:
- Analytics Trust
- Analytics Autonomy
- Analytics Depth of Insight
This will be complemented with information about the roles and processes required to support the modernization initiative.
Additional insights to select the software solutions (not covered in this document), can be found on "Critical Capabilities for Business Intelligence and Analytics Platforms" and "Magic Quadrant for Business Intelligence and Analytics Platforms" or discussed directly with Gartner analysts through phone inquiries.
Analysis
The deployment of a modern BI and analytics platform is a relatively simple technical challenge. Most tools available in the market are easy to set up, administer and work with, but that alone doesn't guarantee success. Gartner often sees organizations deploying modern BI and analytics platforms that offer the wrong set of capabilities to business users, or are used as analytics silos, with no governance or proper integration with the overall BI landscape. The results tend to be below expectations in those cases.
Vendors also, in general, fail to address these issues (or avoid them). There is real risk of falling into the kind of cultural and organizational traps that could stall or totally derail their "land and expand" strategy for the organization. The result is often a silo of self-service analytics capabilities that does not blend properly with the rest of the BI initiative, and will not deliver its full potential value.
Common implementation shortcomings include:
- Failure to provide access to the existing metadata layer (or a proxy of it)s
- Not implementing user-built content validation processess
- Keeping strict limitations on data access and preparation that hinder proper information explorations
- Deploying the platform as a parallel tool to traditional BI and the data science laboratory, without enough touchpoints between thems
- Using a single tool to provide the entire spectrum of analytic capabilities, and then retrofitting user requirements to the wrong solutions
Thus, even if it comes at the expense of a slower deployment, data and analytics leaders must embrace all aspects of the implementation challenge – including platform capabilities, integration touchpoints, governance model, roles and processes – as described in this document. Due to its complexity, the organization should mandate a BI and analytics center of excellence with the objective of ensuring a proper orchestration of all these components.
Moreover, data and analytics leaders must be aware that the modern BI and analytics platform can be delivered with disparate capabilities, leading to different business outcomes. It is their responsibility to provide the right mix of features and a consistent evolution roadmap. This holistic approach will maximize the impact of modern BI and analytics on the organization and allow it to achieve a broader scope.
The following three scenarios lay out potential analytic architecture models for a number of discrete use cases. Follow the advice provided by the companion document "Select the Right Architecture Model for Your Modern BI and Analytics Platform," to identify the recommended option for your organization. Then go through the implementation and operation requirements in the current document. Properly done, this will help regain user confidence in the BI initiative (see "How to Re-engage Users With the Corporate BI Initiative").
Implement a Trust-Focused Model to Better Support Analytics Governance
A very important objective of a modern BI and analytics platform is to empower business users with the ability to create their own insights. The Analytics Trust implementation scenario achieves that objective with a high focus on the reliability of the user built content. The platform components, people roles and processes support a high degree of analytics governance, encouraging compliance with corporate business definitions, trying to keep track of data lineage, and assuring consistency of user-built insights.
Platform Components
Figure 1 shows the most relevant and common platform components for this scenario.
Figure 1. Architecture Model for a Trust-Focused Platform
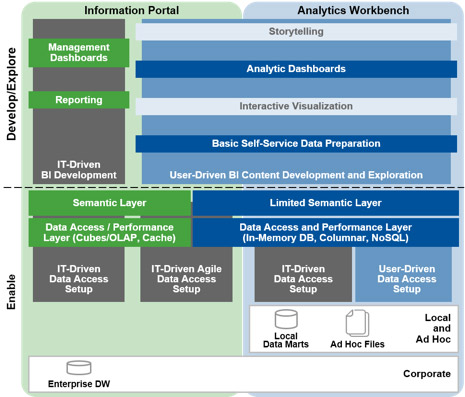
BI = business intelligence; DB = database; DW = data warehouse; OLAP = online analytical processing
Source: Gartner (April 2016)
Represented in green, we have the typical components of a traditional BI deployment, while in blue we depict the modern BI and analytics platform layers. In the background, the IT-driven processes are colored in gray, and those that business users lead are light blue.
These are the most important components:
- Data access and performance layer: In this implementation model, users require access to the existing corporate data repository, complementary data sources (including local data marts and ad hoc files such as spreadsheets) and the ability to blend them together.
- Semantic layer: A key component of this scenario that provides access to the standard business definitions. While most tools from incumbent vendors will offer seamless connectivity to their own semantic layers as a core strength, for data discovery specialists it might be a challenge. Organizations have several options to address the issue:
- Use a self-service data preparation tool to set up a layer of datasets providing the most important metrics and dimensions (see "Market Guide for Self-Service Data Preparation for Analytics").
- Deploy specialized tools to capture, manage and provide access to the corporate semantic layer (see "Market Guide for Metadata Management Solutions").
- Deploy connectors from third-party vendors to link the modern BI platform to the existing semantic layer – for example, Toreo Data is able to provide access from Tableau to SAP BusinessObjects Universes (see "The Rise of Data Discovery Has Set the Stage for a Major Strategic Shift in the BI and Analytics Platform Market").
- Duplicate the most important metadata definitions in the modern platform as the starting point for user-driven analysis. A pragmatic way of achieving this objective, requiring relatively low effort, is to create dashboard templates on the modern BI platform, replicating the key metrics and dimension definitions from the semantic layer and sharing them with users as analytics templates (see "Governance Is Critical for User Empowerment With Data Discovery").
- Basic self-service data preparation: Modern BI and analytics platforms usually incorporate capabilities to perform:
- Basic data blending (including the ability to select by which fields datasets can be joined).
- Transformation and cleansing.
- Renaming and selection of data field format.
- Field split or concatenation.
- Simple data updates (replacing nulls with zero, or changing uppercase to lowercase in fields, for example).
- Creation of simple derived metrics.
- Analytic dashboards: The most important outputs of this implementation scenario. Business users must have an easy-to-master interface that allows the creation of dashboards to support insight sharing with decision makers.
- Interactive visualization: This is a useful component for ad hoc information exploration, but is not essential in this scenario. In some cases, it is not even supported; the selected tool could just target the design and sharing of interactive dashboards.
- Storytelling: Although a good fit for this implementation scenario, because it delivers a guided view of predesigned insights, this is still an emerging capability that most organizations are not yet exploring.
- Information analysts: In this scenario, these are business users that have training on the standard business definitions and information distributed by the information portal, and can design consistent dashboards that follow those standards and share them across the organization according to analytics governance rules.
- BI content managers/curators: Can be located in a centralized team (BI or IT) or distributed across the business. They validate and promote to a governed environment – the information portal – the dashboards built by information analysts, and encourage information analysts (more than they enforce) to adopt sound insight-production practices that maintain a high level of information trust in the organization.
- Semantic layer access setup or replication in the modern BI and analytics platform is the cornerstone of the Analytics Trust scenario. Provisioning the additional layer of dashboard templates that information analysts can rely on to start their analytic process will also be helpful but should not prevent users from creating their own from scratch if required.
- Validation of content produced by business users, and promotion to the information portal before sharing across the organization, will close the loop between users and centralized BI management. The process must be swift and easy, or users will bypass it. Marking content with certification levels (gold, silver) as a result, will help create a sense of purpose and reliability to which the business will adhere (see "Best Practices for Driving Successful Analytics Governance").
- Holistic BI content curation across the BI tiers that develops trust in user-built content will contribute to the success of the BI initiative. It can be delivered through continuous inspection of user-built BI content and data lineage verification. This process cannot be seen as a critique or punishment of users, but rather as help and support for them.
- Include the modern BI platform solution of your incumbent vendor (when available) on the shortlist of tools to assess, to facilitate the initial deployment. Compare it with tools from data discovery specialists that may offer a broader range of analytics capabilities and autonomy.
- Invest effort in the integration of a modern BI platform with an information portal, including semantic layer, data repositories and BI content. This can be achieved, for example, by recreating key components of metadata in dashboard templates made available to users in the modern BI platform (see "Governance Is Critical for User Empowerment With Data Discovery").
- Establish content validation processes and, if created on the analytics workbench, promotion to the information portal.
- Data access and performance layer: Users need to complement access to the corporate data warehouse with local and ad hoc data sources. Information producers expect to gain access to departmental/domain-specific data marts, spreadsheets, external information providers (such as Nielsen, Dun & Bradstreet, weather or economic data, for example) social media feeds and other internal and external datasets of moderate complexity and volume. Modern BI and analytics platforms will typically respond to those requirements as part of their portfolio of capabilities, offering connectors to a broad range of data sources and in-memory database engines as a local data store to accelerate exploration performance.
- Self-service data preparation: Many platforms offering data discovery capabilities also have some self-service data preparation functionality (as described in the previous scenario). Although useful, this might not be enough to address use cases where the data is not ready for analytic exploration. More sophisticated deployments will require a specialized self-service data preparation tool, offering a broader range of data transformation, cleansing and analytics capabilities. Partnerships between vendors providing this capability and data discovery solutions are becoming common in the market, addressing users' needs to close gaps in data preparation.
- Interactive visualization: The key component of the Analytics Autonomy implementation model. Projects in this area often fail or succeed according to how well the interactive visualization component is able to deliver. The solution must be easy to use but, at the same time, offer a broad range of information exploration and visualization capabilities. Functionality required includes:
- An intuitive drag-and-drop user interface to query information
- The ability to create new metrics
- A comprehensive list of visualization options
- Automated chart recommendations
- Information filters
- Custom groups
- Binning definitions
- Entry-level analytics: The ability to use analytic functions to create more-complex metrics, basic forecasting, clustering and other types of mathematical and statistical algorithms, as well as advanced data visualizations. Although not always a requirement, this will increase the complexity of analysis that users will be able to address with the platform, without greatly impact its ease of use. On some solutions, the capability will include the possibility of using wizards and drag-and-drop operations to embed predefined R scripts that implement advanced analytics functions, without writing a single line of code.
- Analytic dashboards: Business users may design dashboards to allow the sharing of insights with a broad audience of information consumers. These are more interactive than the ones typically provided by traditional BI tools, and offer information navigation on an easy-to-explore interface.
- Storytelling: Although not a mandatory requirement, it will be useful to communicate information to the organization and may gain adoption going forward.
- Smart data discovery: Tools that will automate the processes of finding patterns and deriving insights from data, applying under-the-hood statistic methods and machine learning capabilities that don't require advanced skills for operation. In some cases, the tools will be able to generate analytic models (translated into R, for example) that can be embedded across the BI and analytics portfolio or in business processes.
- Information analysts: Business users with a good understanding of their domain —business model, challenges, opportunities, risks, typical data and processes – above-average analytics skills, curiosity, data-driven mindset and a close relationship (often hierarchical dependence) with decision makers in the organization.
- IT support specialists: Can help information analysts in their analytics production – from system setup to content publication, granting them the freedom and the means to achieve their goals. They are not suppliers anymore. Instead, they act as enablers and facilitators – nurturing and monitoring analytics processes.
- Set up access to domain-specific or corporate data sources in a quick and streamlined way, when business users are not able to connect to and collect the data themselves. This process tends to be driven by the IT or BI teams, but may also be assigned to more specialized end users. It must be considered an exception – the rule is to have information analysts with the ability to connect and explore new data sources.
- Information analysis and BI content production are the core processes and are handled by information analysts. Without hindering autonomy, it may be supported by technical and analytics specialists on more-complex activities.
- Certification and publication/sharing of BI and analytics content created by information analysts. The process can be assigned to IT, a business-located BI team or properly trained business users – depending on the level of (de)centralization adopted by the organization.
- Permanent skills enablement program with regular training and experience-sharing workshops for information analysts.
- Include data discovery specialists on the shortlist of potential vendors for the modern BI platform, but also check the evolving modern BI and analytics platforms offered by incumbent vendors.
- Prepare to change the roles of some members of the BI team, from report designers to self-service analytics facilitators.
- Avoid a siloed approach, where the modern BI platform is totally disconnected from the information portal. Try to create a semantic layer proxy with the most relevant business definitions mapped to the data discovery tool.
- Implement analytics governance – supporting the creation and validation of BI content without constraining self-service activities – to avoid falling into a chaotic situation where users often report misleading information. If the selected solution lags in this area, make sure to invest additional effort in the setup of processes and user training to compensate for it, as this is a key requirement across the full spectrum of analytics.
- Data access and performance layer: Users need access to a broad range of data sources, including the data layers accessed by the previous two implementation models. A layer of complex formats could be added as a source for the modern BI and analytics platform (the same data sources that feed the data science laboratory). This could include very large data volumes (from internal and external repositories); streaming and near-real-time data (originated on sensors, for example); or varied data types such as Web logs. The complexity will not go as far as in the data science laboratory, but will still raise performance challenges and could be difficult to understand and explore.
Because users lack the skills to program in technologies such as MapReduce, or to write queries in SparQL or even SQL in most cases, sophisticated but easy-to-use data ingestion capabilities are required, as well as query acceleration features. Technologies such as Hadoop, in-memory database engines or processing frameworks such as Spark (and the connectors to repositories leveraging those technologies) are commonly used. - Self-service data preparation: The ability to easily and quickly blend, transform, and derive new information is critical. Tools offering a data flow user interface are common, but spreadsheet-like user interfaces are also possible as well as script-based solutions. The common denominator is their accessibility for (skilled) business users that aspire to do some of the analytic work typically carried out by a data scientist.
- Interactive visualization and analytics: Being able to query, visualize and analyze data in advanced ways is paramount to this scenario. The platform should offer what is expected on the Analytics Autonomy model and more, including capabilities such as:
- Creation of complex metrics through sophisticated mathematical functions
- Data reshaping features such as binning and hierarchy definition
- Agile and fast-performing querying
- Advanced visualizations (including rendering of very large datasets, complex representation of information like network graphs, or multilayered geographic maps)
- Use of visualization libraries such as D3
- Analysis of Web logs and other semistructured and unstructured data sources
- Easy-to-use forecasting, clustering, predictive modeling and other analytic functionality typically expected from advanced analytics platforms
- Integration with analytics scripting languages such as R, providing visual ways to embed advanced analytics models
Most platforms will not cover all of this functionality. A broader range of capabilities will allow users to address a wider range of use cases, but a specialized tool with a narrow focus could be the right solution to gain more analytic depth and solve specific problems. For example, the use of link analysis tools for cybersecurity threat prevention, or money-laundry analysis, or streaming analytics for use cases involving the Internet of Things. - Smart data discovery: Tools that will automate the processes of finding patterns and deriving insights from data, applying under-the-hood statistic methods and machine-learning capabilities that don't require advanced skills for operation. In some cases, the tools will be able to generate analytic models (translated into R, for example) that can be embedded across the BI and analytics portfolio or into business processes.
- Citizen data scientists: To leverage the analytic capabilities and create advanced insights. These are skilled business users, with experience in information exploration, dashboard creation and some degree of analytical and technical capabilities. Some could be able to develop basic analytic models given the right user interface, or even write simple SQL queries. Their knowledge will not match that of a data scientist or an IT technical specialist, though.
- Optionally, there may exist data scientists with the ability to further analyze the insights created on the modern BI platform, as a first analytic exploration before using the data science laboratory's capabilities.
- Technical specialists (eventually from IT): Able to set up access to very complex data sources.
- Set up access to complex data sources in a quick and streamlined way.
- Communicate the insights that have been uncovered to the data scientist for further analysis.
- Hand analytic models over to data scientist and information analysts for embedding in analytic dashboards and business processes.
- Be part of a permanent skills-enablement program with regular training and experience sharing workshops with other citizen data scientists.
- Consider using innovative analytic capabilities such as smart- or Hadoop-based data discovery tools that might be offered by new and smaller vendors.
- Establish collaboration processes between the citizen data scientists and data scientists.
- Support a culture of experimentation and analytic curiosity that is not constrained by the predefined assumptions of traditional BI and KPI monitoring.
- Build a holistic, modern BI and analytics platform gradually – spanning from the information portal to the data science laboratory to create an analytics continuum, with time to grow and consolidate skills and processes.
- Prepare to follow a portfolio approach and integrate components from different vendors, identifying and deploying tools that can integrate with each other.
- Make the complementary investments in information management and governance that will act as a backbone for the modern BI platform
Capabilities layers with less relevance for this implementation scenario include:
As a general rule, traditional BI vendors that offer data discovery tools differentiate by providing better integration with their existing information-portal-focused products and, thus, are a good fit for this implementation scenario.
MicroStrategy, for example, shares the semantic layer between traditional reporting and data discovery, and also adds the option of using standard reports as dataset inputs for exploration on its data discovery tool – Visual Insight. Alternatively, there are vendors offering modern BI capabilities that are focused on the information portal – with agile creation of reports and dashboards but reduced ad hoc information exploration capabilities. Domo and Yellowfin would fit into that category. Nevertheless, the implementation of this scenario with data discovery specialists is also possible.
People and Roles
The Analytics Trust implementation scenario provides a level of self-service analytics to business users, without significantly disrupting the BI content creation processes in the organization.
The most relevant roles are:
The top challenge for these roles is to make sure that they break away from the centralized, IT-driven content development model, into a decentralized insight-creation environment that is able to preserve information reliability and, at the same time, increase agility and decrease time to insight. This must be the mission at all times.
The activities of the centralized BI team and IT are centered on enabling rather than doing. Their role is to train, transfer knowledge and coach local staff in the development of their own insights. The organization may employ certifications or "gamification" methods to encourage user adoption and drive acceptable behavior (see "Redefine, Reorganize, Revamp and Rebrand Your BICC to Shift Focus to Analytics," "How to Evolve the BICC to Enable Data Discovery-Based Self-Service BI" and "Use Incentives to Bolster BI Adoption and Advance Program Maturity").
Processes
To create insights that users can trust, there is a need for processes that establish access to the right data, create the metadata foundations, and validate and share content delivered by users.
The most relevant are:
Creating trust, without a negative sense of control by the centralized team, and delivering greater agility than before, may prove to be difficult. Successful case studies that implement processes similar to the ones described above prove it is possible (see "Use Analytic Business Processes to Drive Business Performance").
Recommendations:
Implement an Autonomy-Focused Model to Nurture an Information-Driven Culture
The tools, roles and processes of this implementation model must be designed to support a business-driven environment, offering self-service and a fair amount of analytics features. The target audience is composed of today's spreadsheet users that have high demand for insights, but do not possess the advanced skills of data scientists or technical specialists. They work closely with business decision makers across the organization and must be able to quickly address their questions without needing to go back to IT or the BI team to ask for access to information or help.
Platform Components
Figure 2 shows the most relevant and common platform components for this scenario.
Figure 2. Architecture Model for an Autonomy-Focused Platform
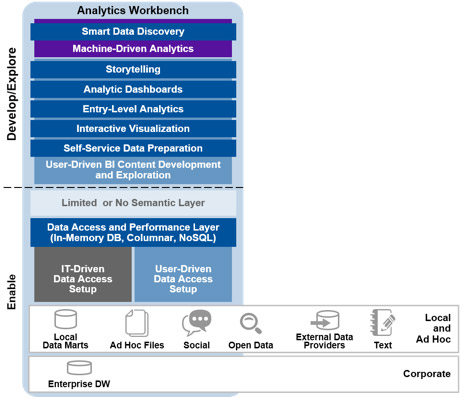
BI = business intelligence; DB = database; DW = data warehouse
Source: Gartner (April 2016)
Although similar to the previous architecture model, the importance of integration with the existing traditional BI platform is reduced, favoring instead more advanced information management and analytics capabilities.
The most relevant capabilities are:
As a general rule, independent vendors such as Tableau, Qlik or TIBCO offer greater agility and a broader range of analytic capabilities to business users, with the drawback of offering more limited semantic layer capabilities and raising challenges on the connection to existing ones (if not a total impossibility, depending on the incumbent BI tool). Data discovery solutions from traditional BI vendors are evolving quickly, though, and can also be considered for this scenario. Microsoft, for example, historically known as a provider of traditional BI reporting tools, has addressed this need with its Power BI offering, and is gaining traction in the market.
People and Roles
This Analytics Autonomy implementation scenario offers the business the ability to create insights with low to no IT support.
The most relevant roles are:
The autonomy demanded by business users in this implementation scenario can only be achieved if proper consideration is given to the establishment of roles. Users must evolve from rogue spreadsheet authors to officially recognized and supported information analysts. IT must also evolve, and that will not be easy in many organizations. The technical specialists must go from supplier to facilitator, or risk jeopardizing the modernization process. As in the first architecture model, their activities must be centered on "enabling" rather than "doing."
Processes
Autonomy is the relevant keyword impacting user activities in this scenario. Supporting it, business users expect to have agile and easy-to-execute analytics-related processes.
The most relevant of them are:
Business users, the BI team and IT must work together – to truly collaborate, not just react to demand and supply – to guarantee the success of the Analytics Autonomy implementation model. The processes described here, when implemented, address that.
Recommendations:
Implement an Insight-Focused Model to Drive Innovation
The Analytics Insight implementation model is the most advanced form of modern BI and analytics platform deployment. It may require tools that are less commonly used (often from smaller and innovative vendors) that provide capabilities able to address complex use cases, but are relatively easy to explore and accessible to the more analytic- and tech-savvy user. It is used to empower the citizen data scientist – a new role that bridges the gap between the pervasive and business-cognizant information analyst; and the difficult-to-find and highly skilled data scientist.
Platform Components
Figure 3 shows the most relevant and common platform components for this scenario.
Figure 3. Architecture Model for a Depth-of-Insight-Focused Platform
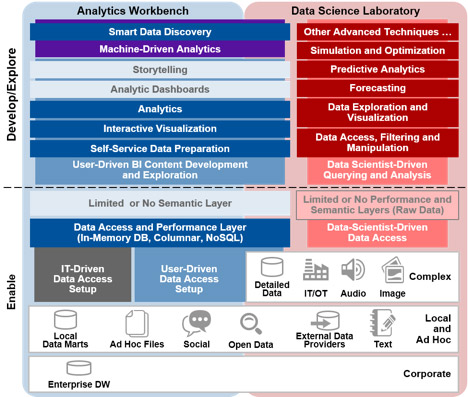
BI = business intelligence; DB = database; DW = data warehouse; IT/OT = information technology/operational technology
Source: Gartner (April 2016)
The most relevant capabilities are:
Vendors such as ClearStory Data, Pentaho and Platfora offer tight integration with NoSQL data sources that can support complex information loads. Advanced analytics specialists like SAS Institute provide more comprehensive integration within a data science laboratory environment, where more-skilled users will try to address more-complex questions. These are just two sets of tools that could support the implementation scenario, but the list of potential tools is much broader.
People and Roles
This implementation model can create a very important new role in the organization – the citizen data scientist (see "Smart Data Discovery Will Enable a New Class of Citizen Data Scientist").
It supports/requires other roles too, including:
Processes
The citizen data scientist is deeply entrenched in business areas, with ample interactions with information analysts and decision makers. The most relevant processes that need to be added to support their activity are related to the availability of data sources for analysis, and the establishment of links with the data science laboratory.
They might be required to:
Due to the innovative nature of the analytic activities expected from this implementation model – often applying unproved, and maybe even unconventional, tools and analytic technics – the organization must also be willing to experiment with innovative ways to empower citizen data scientist. Analytic hackathons, information-discovery workshops, and swapping of analysts between business units to foster knowledge transfer, are all examples of less-conventional activities that can be adopted.
Recommendations:
Combine Architecture Models to Amplify the Scope and Impact of Your BI Initiative
Organizations should work to expand the capabilities offered by their modern BI and analytics platforms, not just wait for their vendor to deliver additional functionality. The implementation process should be gradual, but persistent, extending the platform's span from the information portal to the data science laboratory, in an integrated architecture. Because no single vendor offers all the required components, it may be necessary to integrate solutions from multiple providers.
Figure 4. Holistic Modern BI Platform Architecture Model
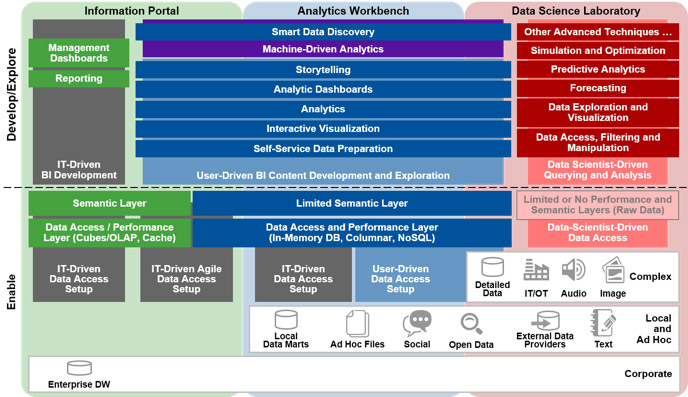
BI = business intelligence; DB = database; DW = data warehouse; IT/OT = information technology/operational technology
Source: Gartner (April 2016))
While most vendors are growing their capabilities and expanding their footprint from the information portal to the data science laboratory, there are still gaps that can't be solved by a single tool, leading to solution design problems and integration pains. The top challenge will be the integration of tools from different vendors – within and across the tiers – to create the touchpoints that support the analytics continuum.
Most of the vendors' investment is spent on broadening the scope of their platforms, but some solutions are also improving their ease of integration and interoperability with other tools. Consider them as potential alternatives, or as a complement to monolithic solutions. Third-party data connectors that are able to expose the semantic layer of information portal tools to modern BI platforms can also support integration.