Automation Outcomes, Not Just Automation Rates
How to judge an automation program’s success through overall business impact
Research from Gartner
How CIOs Can Choose the Right Metrics to Quantify the Benefits of Financial Services Automation Investments
Misaligned metrics can stop any hyperautomation project and make it hard to build the business case for the next one. To combat this, bank, investment and insurance CIOs need to use metrics aligned to the business outcome. We provide a list of metrics with key considerations when making decisions.
Overview
Key Findings
- Banks and insurers find it easier to measure efficiency in terms of time saved and reduced FTE. However, they find that it is harder to correlate the success of automation initiatives to other necessary business results like risk reduction and revenue generation.
- A common challenge among banks and insurers is that without measurable attributes tied to the business goal, prioritization of automation projects reverts to internal politics and negotiation. Projects then get downgraded as they are wrongly assessed as not creating value.
- Employees are more likely to indicate that technology implementations are successful when they are involved in the concept and design phase than when they get involved only when the technology is ready to use.
Recommendations
Bank, investment and insurance CIOs driving financial services technology modernization and transformation should:
- Correlate each automation initiative to desired outcomes by choosing success metrics that are aligned to the business goal, using the suggested metrics in the downloadable file included in this research. These should be clearly defined at the start of each project.
- Employ the SMART criteria to ensure that metrics are precise, measurable and traceable, and clearly lead to tangible returns.
- Deliver clear messages to employees by setting employee engagement metrics, such as staff training on new skills and attrition across all automation initiatives, in addition to the desired business goal.
Strategic Planning Assumptions
By YE22, 60% of automation projects will fail because results metrics are not tied to business outcomes.
Introduction
While CIOs are responsible for automation technology, it’s the business metrics that clients tell us that make or break the perception of a successful project in their organizations. And when we consider business metrics used to determine the success of automation initiatives, the most immediate thought is often cost reduction and fewer FTEs. When robotic process automation (RPA) and other automation solutions like chatbots, optical character recognition (OCR) and artificial intelligence (AI) were first considered as automation tools, the key driver was typically a way to reduce resources and, therefore, expenses.
CIOs can find themselves in a tough spot when it comes to metrics, because their teams are not always the direct beneficiary of the business outcomes (compared to operations or the line of business). But CIOs are often responsible for managing the automation portfolio — choosing automation technologies, supplying resources to business and operational teams and prioritizing automation projects. CIOs need a mechanism for choosing which automation projects to address and in what order. To be successful, they must establish a framework that facilitates business participation and ownership and, ultimately, improves the decision making around automation initiatives. Aligning stakeholders to make decisions based on expected business outcomes is most likely to lead to successful initiatives and pave the way for future projects.
As business and IT leaders in banks and investment firms continue to invest in and implement automation initiatives, those with increasing automation maturity levels are focusing on other business benefits besides cost reduction. These might be a better customer experience or the ability to offer new products and services. However, business metrics are often tied to the process being automated rather than to the business goal. For example, many newly automated onboarding processes measure the time saved rather than growth in the number of applicants, which is the real goal of creating a streamlined process. When Ping An introduced “intelligent authentication,” it adopted face and voice recognition. While it could have simply measured the number of clients with “biological files,” it also measured the percentage of abandoned applications, because it indicated fewer issues in the sales process.1 What resulted from Ping An’s metrics decision was a more comprehensive evaluation of the impact of automation on business operations that would justify the investments made. (See Figure 1 for automation metrics aligned with six desired business outcomes of automation initiatives, and download a spreadsheet with a more complete list.)
Figure 1.
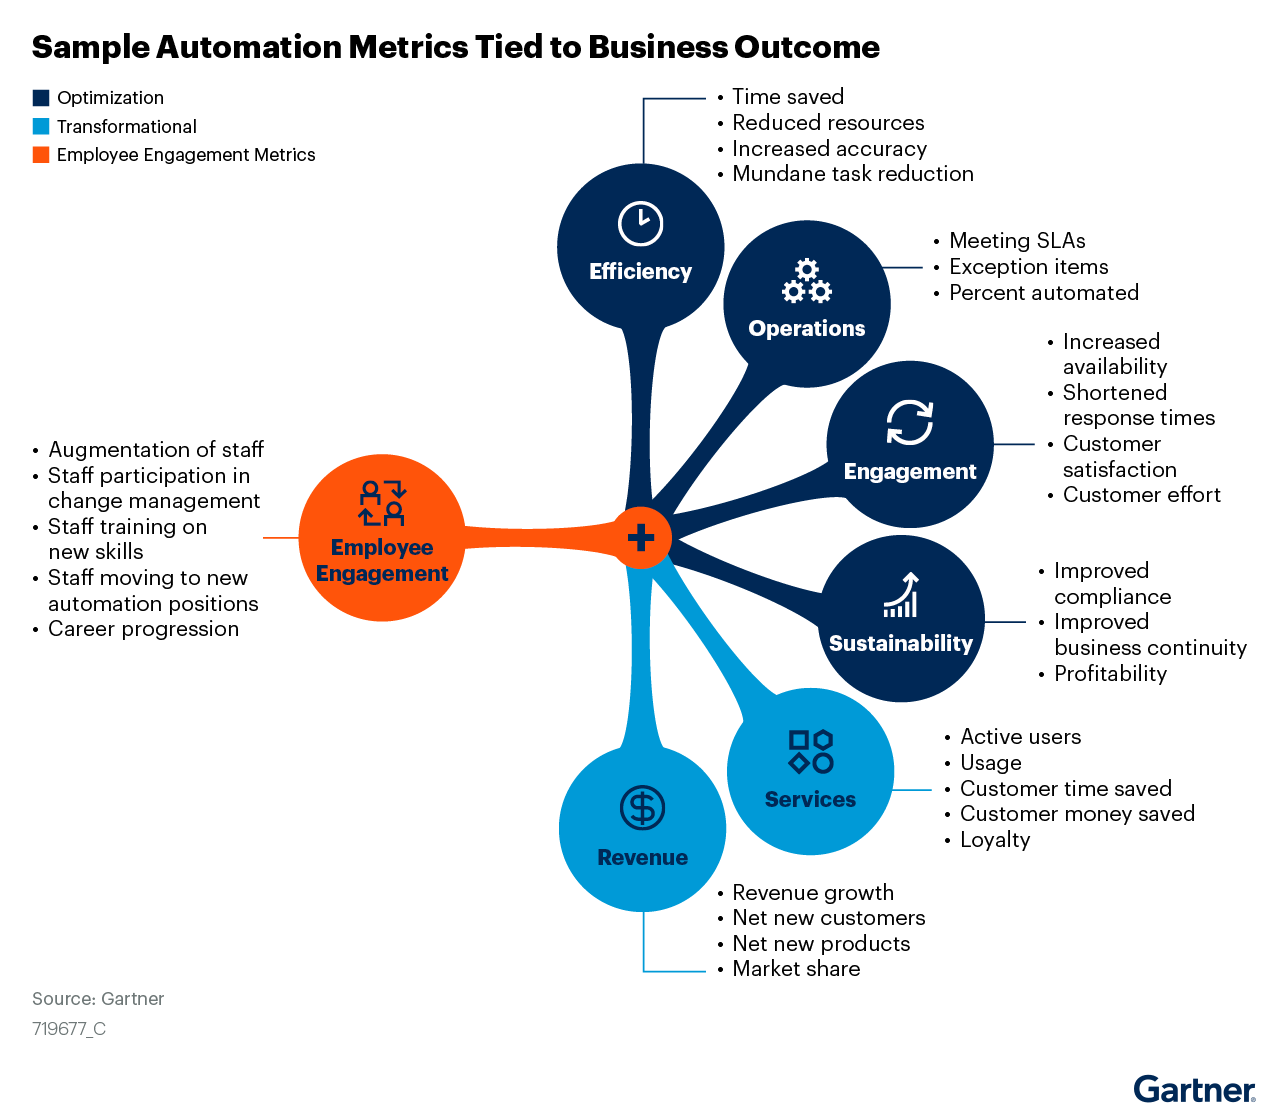
Download Hyperautomation Metrics Tied to Business Outcome Goals
This research will provide three best practices to ensure that metrics are defined according to the business goal. For more information on the optimal approach to automation, see 4 Steps to Automation Success in Financial Services.
Analysis
Correlate Each Automation Initiative to Desired Outcomes by Choosing Success Metrics That Are Aligned With the Business Goal
Before beginning any automation project, it’s critical that the organization’s stakeholders clearly define the business goal. Often the goal and the metrics get confused between the business problem to be solved and the symptoms of that problem, as in the case of the onboarding example above. Is the goal to reduce resources or to create a new streamlined onboarding process to make it easier for new customers to apply? It can be both, and it’s important that stakeholders have a set of baseline metrics for each goal, against which you can measure the results 30, 90, 180 and 365 days after completion. This provides the capability to evaluate and validate assumptions used in this project as learning material for future projects.
Gartner has identified six types of business goals to consider before beginning any project. Each has its own unique set of metrics to measure success, and each metric can and should be tied back to cost, risk or revenue impact. These six business goals are important because Gartner research finds that outcome-driven metrics enable CIOs to effectively partner with their business stakeholders to drive business value. Examples are discussed below, and a full set of metrics, along with mapping to the key metrics of cost, risk and revenue can be accessed in the downloadable spreadsheet.
Efficiency — Efficiency is simply making an existing process better, whether it’s faster, less expensive or more accurate. For example, implementing automation technology to enable a faster loan documentation turnaround time or remove swivel-chair data entry for new insurance policies is what makes the process more efficient; therefore, this is what should be measured. Possible metrics may include reduced turnaround time, fewer FTE required, fewer handoffs and improved accuracy.
Operational Performance — Automation options open opportunities to create entirely new processes to provide service in a new way or make it easier for employees to do their jobs. Many banks and credit unions in the U.S. used automation tools to quickly create new operational processes with the introduction of the Paycheck Protection Program (PPP) in April 2020, as part of the government response to the economic impact of the COVID-19 pandemic.2 Even more are planning to use automation in the most recent round, which began in January 2021.3 Possible metrics will depend on the process, but some options will include the ability to meet new service-level agreements (SLAs), what percentage of the new process can be automated and the number of exception items created as a percentage of the total.
Customer Engagement — Customer engagement encompasses many types of change, including making the customer experience easier, faster, less expensive or more accurate, as well as creating opportunities for customers to engage in a new way or more frequently. For example, many insurers are now deploying chatbots to answer customer questions, augment the new business capture process and support servicing activities. It is important to ensure that what is measured is the actual customer experience — not the efficacy of the process (that is, the bot answer rate) — so that the organization reduces the risk of customer dissatisfaction and attrition and also maximizes the opportunity for loyalty and new revenue. Metrics should include shortened response times, reduced dwell rates, customer satisfaction and customer effort expended.
Sustainability — Sustainability in this definition of value refers to the long-term sustainability of the organization and is inclusive of business continuity and compliance. Sometimes, the business case for automation initiatives is less straightforward but is of vital importance to the organization. When banks and insurers had to suddenly begin working remotely in 2020, many targeted paper-based processes for automation because those processes impeded business continuity. When one can no longer move a piece of paper from desk to desk in the same building, processes take longer, or in extreme cases, can’t be done at all.
As an example, Lloyds of London is in a targeted insurance market that has long-standing traditions where face-to-face interactions are seen as important, and things are done in a set way. One element of the tradition involved employees printing large insurance documents, handwriting reinsurance splits on the documents and stamping the documents with a physical stamp. Pandemic circumstances precluded face-to-face interaction, so the documents had to be handled electronically, the reinsurance rates had to be added through some BPM-controlled process, and the stamp was replaced with an e- signature. This process has been digitized, and it’s unlikely that it will return to its manual roots.
Improving the bank or insurer’s compliance with regulations, improving business continuity and adding to the overall profitability of the organization are all valid considerations when building a business case.
New Services — Automation makes it possible to offer new services for customers by providing easier access to and understanding of data. One example that is becoming standard is adding insights to help personalize customers’ financial decision making throughout the channels using dashboards — alerts, as well as conversation starters — for frontline staff. Another example — some banks have been using analytics, AI and machine learning to provide transaction data, allowing them to offer a new service to their merchant clients.4, 5 Metrics related to these new services should measure the customer impact, as well as the growth of the service. Metrics to include may be active user growth rate, customer time saved, financial empowerment support and customer actions as a result of the service.
Increasing Revenue — Because automation is so often considered an efficiency mechanism, the opportunity for new revenue can be overlooked. However, when new processes have to be created to support new bank or insurance products, automation can be the difference between success and failure. An example may be entering a competitive mortgage market. In this situation, the speed of the bank’s decision making can be a differentiator between gaining the business or losing it. In this case, metrics tied to the process would be useful, but not sufficient. What is important is to measure the business value such as new customers gained, revenue growth and market share.
In addition to choosing metrics aligned to the business goal, ensure that metrics are not too broadly scoped. While it’s acceptable to have some qualitative, subjective metrics — input on ease of use, for example — for informational purposes, they are poor indicators of the organization’s financial and sustainability goals to reduce costs, increase revenue and mitigate risk. Safeguard against overreliance by applying a quantitative measurement to every business goal.
Employ the SMART Framework to Ensure That Metrics Are Precise, Measurable, and Traceable and Clearly Lead to Tangible Returns
2021 will challenge financial services CIOs with many facing lower budgets, requiring them to make difficult decisions on where to focus IT spending. This need for tangible ROI to justify spending requires that CIOs work with stakeholders to instill a good discipline that will help with the prioritization of automation initiatives.
A key approach to automation prioritization is to apply a framework that quantifies the maturity and readiness of the organization for automation initiatives, one that ensures that metrics are precise, measurable, and traceable and clearly lead to tangible returns. Use cases selected should adhere to the principles of the SMART framework.
Specific:
- Metrics should be clearly defined and understood by stakeholders.
- The measurement must be precise, that is, the measurement must be able to be accurate.
- Measurements should be aligned to a specific business goal and not generic in nature.
- The metric should reference a direct numerical value linked to an activity or behavior.
Measurable:
- A baseline measurement must be quantified at the start of the project.
- The organization must have the means and capabilities needed to measure the metric regularly.
- There must be a clear definition of what teams are needed (for example, IT, operations, data analytics) to get the data for this metric.
- Where applicable, it may need to be combined with other metrics to quantify value.
- How the impact is realized must be identified. For instance, is the impact obvious or is it a more hidden byproduct that is less easy to trace and associate with the initiative?
- Incorporate a counterpoint measurement to identify if or where automation has a detrimental impact on an associated measurement, for instance, if automating a process results in an increase in staff attrition.
Actionable:
- The metric must be informative in that it can assist the stakeholder in deciding on a next course of action.
- It must be possible to isolate, trace and associate the impact of the change to the results.
- The initiative must be aligned to enterprisewide goals.
- Other byproducts — such as time freed up for resources to be deployed on more value-add tasks — should be quantified when measuring the impact.
- The metric should affect behaviors in a predictable way during and/or after measurement.
Relevance:
- The metric must resonate with senior management as one that quantifies success.
- Impact on financial services business operations must be clear as to possible results, such as whether the change impacts business volume, improves customer service or reduces costs.
- There must be a clear way to identify the order of magnitude, specifically, whether it will be incremental or transformational on business outcomes.
Time-Bound:
- There must be a clear understanding as to how often and by what margin the value of this metric changes.
- There must be an ability to identify a time-related threshold that applies to the metric, for example, improvement in customer satisfaction is expected within the first 90 days.
- It must be clear whether the task is high-frequency so impact is felt or realized instantly.
Financial services CIOs can apply these principles to rank their initiatives and gain executive and user buy-in by demonstrating wider enterprise impact.
Deliver Clear Messages to Employees by Setting Employee Engagement Metrics Across All Automation Initiatives, Regardless of the Desired Business Goal
Employees across the organization may be worried about the impact of automation if they don’t have a clear vision for what it will bring and they don’t understand what it will mean for their roles. In the Gartner 2021 Employee Technology Survey,6 47% of employees who have experienced using automation technologies indicated that automation is a threat to current jobs. While CIOs are only directly responsible for their IT organization, unmotivated or nervous employees in any part of the organization can derail an automation technology implementation.
Employees, sometimes unconsciously, can delay or fail to share needed information to ensure that the new processes meet business and customer needs. In the same survey, 39% of employees who were not involved until the technology implementation indicated that their employer did not ask for any feedback about the technology, and 29% said they did not communicate about the rollout.6 To have the best chance of a successful project, CIOs will need to work with the leaders of all affected employees and with human resources to ensure that employee engagement is being measured, regardless of the desired business outcome for individual projects.
But what exactly does one measure? Qualitative metrics or metrics that are indirectly assessed, like “perceived employee buy-in,” are important but can be too broad to measure real success. Subjective metrics should be kept to a minimum and have clear and concise rationale behind the choice to include them. This allows the organization to capture sentiment, but also requires that sentiment be supplemented by quantitative metrics tied to cost and risk outcomes. CIOs should therefore be thinking about language and measurements that are aligned with the enterprisewide KPI measurements of success to position the value to the employee themselves. Such measurements will help the organization build an automation culture that will yield increased cost savings and risk reduction. Table 1 provides examples of metrics specifically tied to employee engagement as a result of automation initiatives.
Table 1: Sample Automation Metrics Tied to Business Outcome
| Metric Title | Definition | Employee Measurements | Enterprisewide KPIs |
|---|---|---|---|
| Augmentation of staff | Automation technology is being used to assist staff in their roles, not replace them. |
|
|
| Staff participation in change management | Staff impacted by automation projects are involved in the definition, scoping and/or implementation. |
|
|
| Staff training on new skills | As new tasks and roles are required, existing staff are being trained to be able to meet the new needs. | Percentage of staff trained on new skills needed as a result of the automation project. This can include staff staying in their current roles or staff moving to roles as a result of the automation project. |
|
| Staff moving to new positions | Affected staff take on new roles within the organization when automation projects eliminate their current positions. | Percentage of staff roles eliminated that were offered new positions at the same or a higher job level. |
|
| Employee satisfaction with project/change | Gauging the feelings that employees have after the completion of an automation project. | Survey-based, this measures how employees feel about specific automation projects, not just as part of companywide employee surveys. |
|
| Feedback gathered | Asking employees for their input on what worked and what did not work for an automation project after it is completed. | Percentage of employees who provided both qualitative and quantitative feedback on the automation project (can be combined with employee satisfaction metrics). |
|
| Turnover | The impact of employees leaving their role or the organization. | Attrition rates in affected teams (before and after). |
|
Source: Gartner
Acronym Key and Glossary Terms
| Hyperautomation | Business-driven hyperautomation is a disciplined approach that organizations use to rapidly identify, vet and automate as many business and IT processes as possible. Hyperautomation involves the orchestrated use of multiple technologies, tools or platforms. Examples of these include AI, machine learning, event-driven software architecture, robotic process automation (RPA), BPM/iBPMS, integration platform as a service (iPaaS), low-code or no-code tools, packaged software and other types of decision, process and task automation tools. |
Source: Gartner Research Note G00719677, Nicole Sturgill, Laurie Shotton, 4 March 2021
Evidence
1 Major Insurer Ping An Using AI to Improve Efficiency, ChinaDaily
2 Banks Use Software Bots to Process Surge of Pandemic-Related Loans, The Wall Street Journal (subscription required)
3 Small Lenders Embrace Automation for Latest PPP Round, American Banker
4 Nedbank Unveils Data Analytics Tool, IT Web
5 FAB Launches Analytics Portal for Merchant Customers, ITP.net
6 Gartner’s 2021 Employee Technology Survey was conducted online between November 2020 and December 2020 with 3,181 respondents, including 412 from the insurance industry and 551 from the banking industry, working in organizations with above $50 million in annual revenue from North America, Europe, Latin America and APAC. The respondents are employees who are users of technology, i.e., employees working in entry- level and midlevel positions and department heads.