Learn how high-performing CMOs master their marketing channel strategy
- Gartner client? Log in for personalized search results.
Build a Sustainable Marketing Channel Strategy
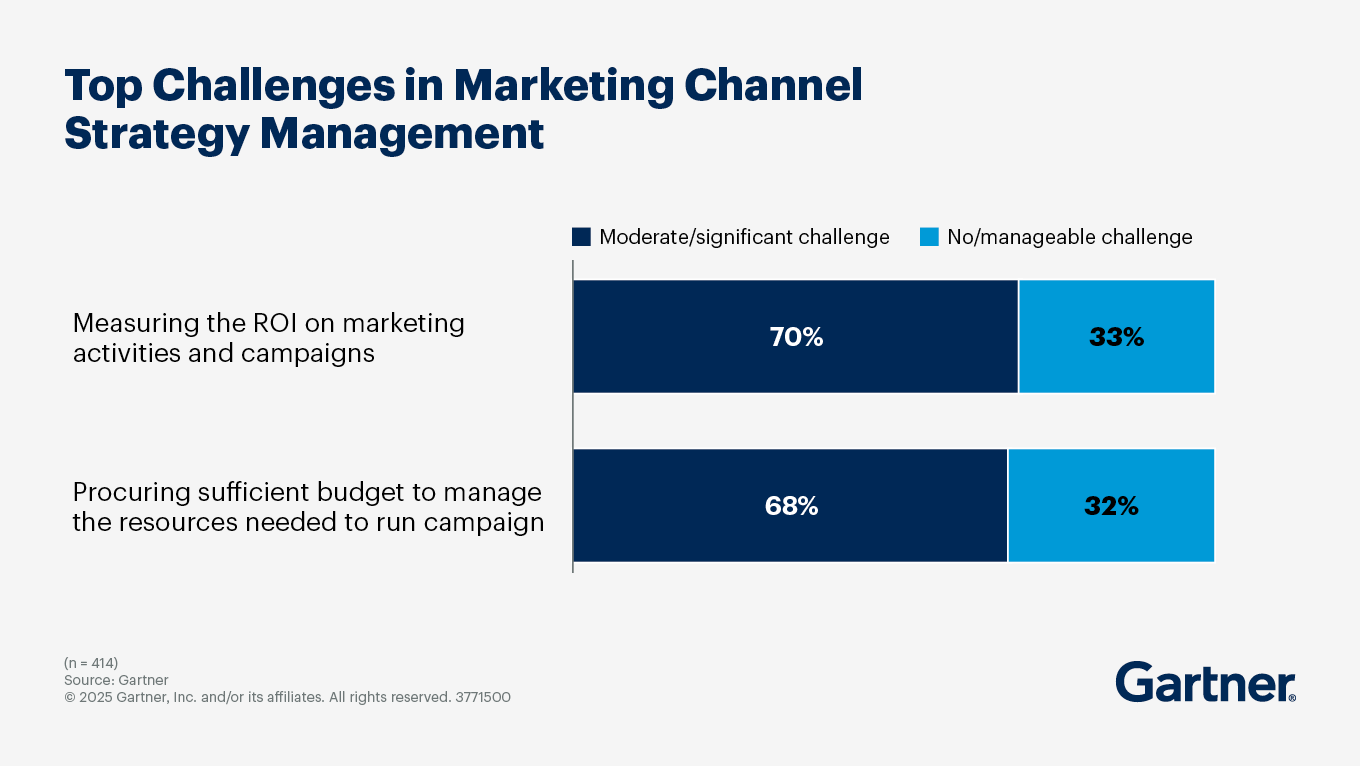
87% of marketing leaders report that they experienced campaign performance issues in the last 12 months.
CMOs are ramping up campaign activity but face challenges in managing budgets, capabilities and stakeholders.
Download the Gartner Marketing Channel Strategy Research to:
- Discover an integrated approach to campaign management and closing capability gaps.
- Learn how high-performing teams overcome these challenges
- Build a robust plan for channel and campaign success
About marketing channel strategy
Marketing leaders continue to face significant headwinds: lacking sufficient budgets to support all its plans; missing the hard and soft skills material to delivering results; limiting success through suboptimal campaign performance. But it’s also clear that there’s a path to improvement.
Gartner's research explains how to take cues from high-performing marketing teams and build a strategic roadmap for channel and campaign success. It is important to learn what these teams do differently to elevate your strategic influence as a CMO and apply the insights to drive meaningful impact within your organization.
Marketing Channel Strategy FAQs
What is a marketing channel strategy?
A marketing channel strategy is a plan to connect to your audience and meet customer needs through various marketing channels.
How to develop a marketing channel strategy?
CMOs must develop a customer-centric marketing strategy that meets customers’ needs across digital and in-person channels throughout their journey. When setting out the strategy, CMOs must answer the following questions:
What are the macro context and trends that affect how the organization operates?
What would I need to execute a channel-agnostic strategy?
How would a strategy shift affect current processes, people, technology and data?
Are there “quick wins,” such as lead scoring or website personalization, which we can execute to drive momentum and build on?
How does channel strategy relate to marketing strategy?
Marketing strategy defines how your brand will achieve its marketing goals (i.e., to reach a particular audience and convert them to customers). Developing a solid channel strategy enables you to deliver a clear and cohesive cross-channel experience, both online and offline, which plays a vital role in spreading the word about your brand and reaching potential customers.