Discover how Gartner works with you to tackle your top challenges.
- Gartner client? Log in for personalized search results.
Gartner for Marketing
Get actionable, objective insights, guidance, and tools that Chief Marketing Officers and their teams need to deliver business impact.
I want to more about:

Webinar: Business Implications of U.S. Federal Policy Changes
Hear from Gartner experts on how clients from across the C-suite are taking action and leading in times of change.
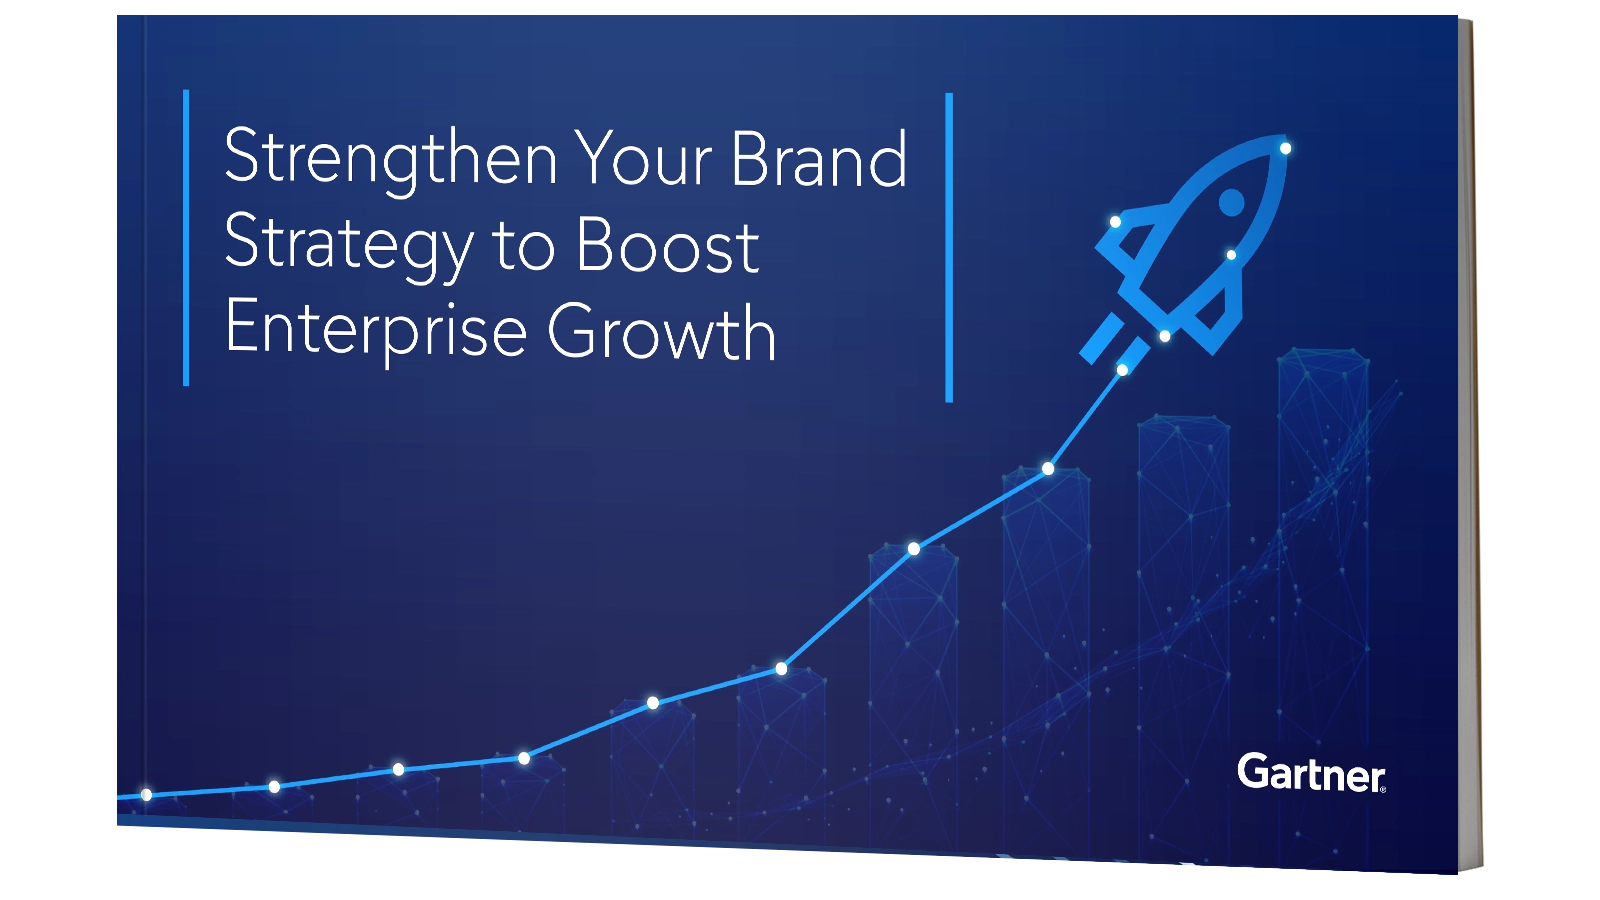
Reimagine Your Brand for the Age of AI
Adapt, differentiate, and lead with a brand strategy designed to unlock growth.
2026 Marketing & Communications Awards
Discover who made the cut in the 2026 Awards and explore the standout work recognized across eight categories.
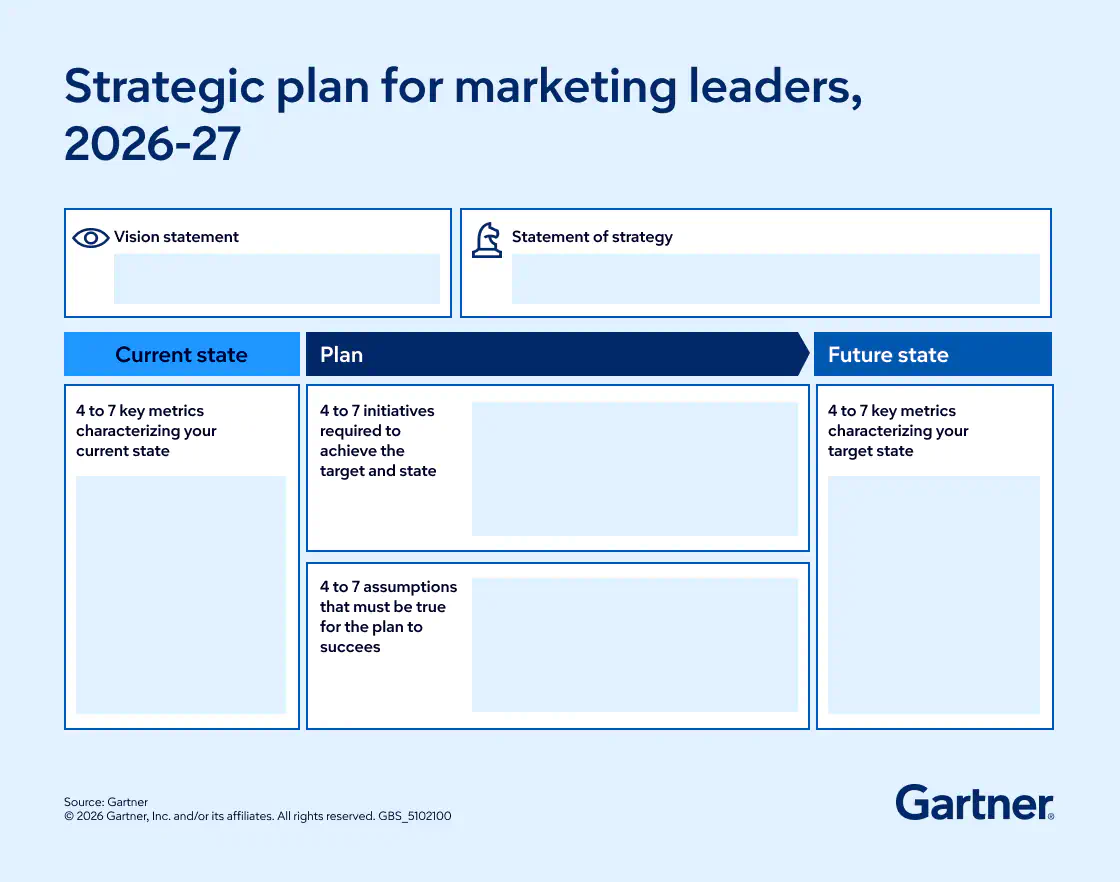
Marketing Strategic Planning Template for 2027
Learn how to build, communicate, and execute a high-impact marketing strategy with a one-page planning template, a proven five-step framework, and guidance for securing stakeholder buy-in.
CMO success starts here.
 ▶
▶
Attend a Conference
Join Gartner experts and your peers to accelerate growth
Gather alongside your peers in Denver to gain insight on emerging trends, receive one-on-one guidance from a Gartner expert and create a strategy to tackle your priorities head-on.
7 – 9 Jun 2027
Gartner Marketing Symposium/Xpo™
Denver, CO

Insights to drive stronger performance
Client Success Stories
See how Gartner helped other companies achieve their marketing goals.
- Improve Process
- Optimize Operations
- Save Time
Enabling a Personalized and Digital Customer Experience (CX)
Find out how Gartner helped AARP achieve substantial CX improvement and contribute to $1.8 million in cost savings across the organization.

Increasing Revenue with a New Digital Strategy
Find out how Gartner helped Pennsylvania State Employees Credit Union (PSECU) investment from the board, transform its website and improve growth.

Elevated Customer Experience While Saving Time and Money
Find out how Gartner helped Consumers Energy Company evaluate their existing technology and adjust their marketing org structure to improve customer experience.