Discover how Gartner works with you to tackle your top challenges.
- Gartner client? Log in for personalized search results.
Gartner for Marketing
Get actionable, objective insights, guidance, and tools that Chief Marketing Officers and their teams need to deliver business impact.
I want to more about:

Webinar: Business Implications of U.S. Federal Policy Changes
Hear from Gartner experts on how clients from across the C-suite are taking action and leading in times of change.
Exploring Strategic Insights From Gartner’s 2026 CMO Spend Survey
Discover how leading CMOs are reallocating budgets, embracing AI, and prioritizing agility to drive growth amid enterprise transformation. Join this webinar for insights on strategic spend, channel optimization, and building resilient marketing organizations for 2026 and beyond.
2026 Marketing & Communications Awards
The 2026 Awards finalists are here, highlighting the bold ideas and breakthrough work shaping marketing and communications worldwide. Explore the eight categories and discover the organizations, initiatives, and leaders setting the benchmark for excellence.
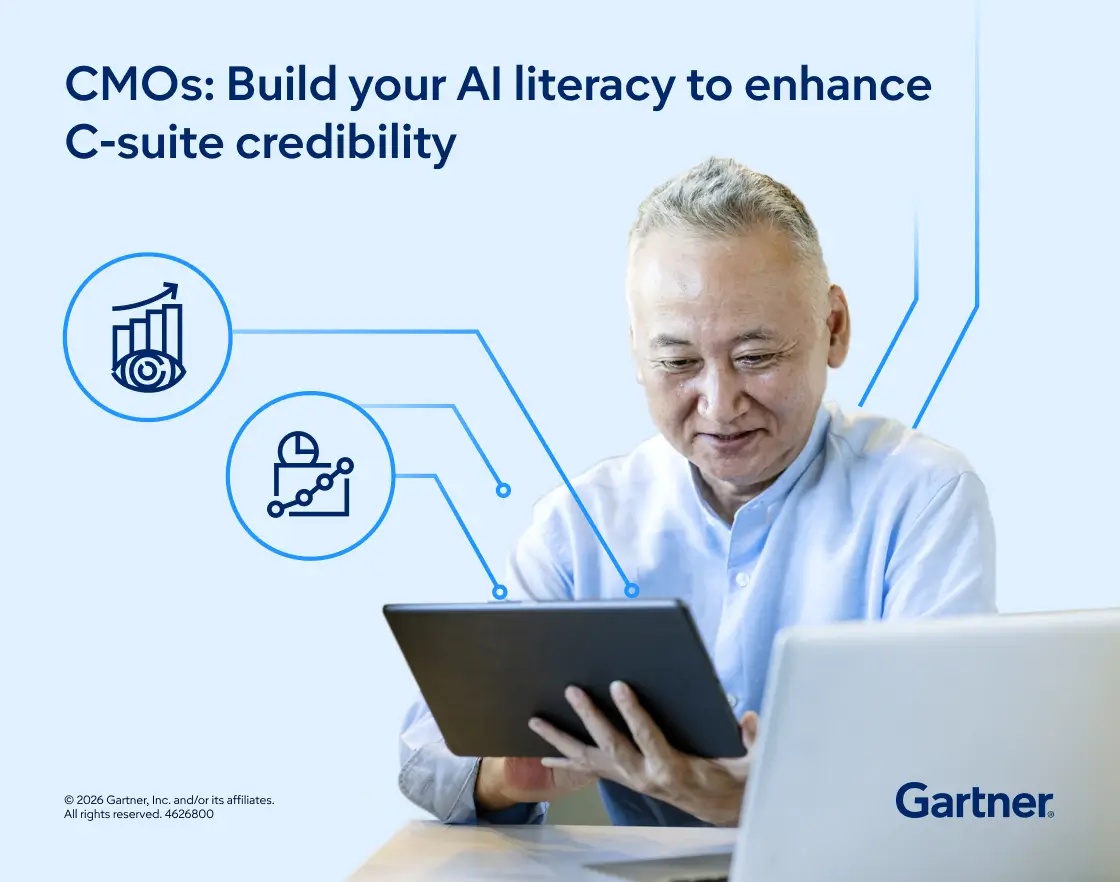
Strengthen C‑Suite Impact with AI
To stay credible as AI disruption accelerates, CMOs must build AI literacy now. Learn how to identify AI use cases that drive impact, strengthen fluency by understanding limitations, elevate AI to a C‑suite growth capability, and increase influence by uniting leaders around shared priorities.
CMO success starts here.
 ▶
▶
Attend a Conference
Join Gartner experts and your peers to accelerate growth
Gather alongside your peers in Denver to gain insight on emerging trends, receive one-on-one guidance from a Gartner expert and create a strategy to tackle your priorities head-on.
7 – 9 Jun 2027
Gartner Marketing Symposium/Xpo™
Denver, CO

Insights to drive stronger performance
Client Success Stories
See how Gartner helped other companies achieve their marketing goals.
- Improve Process
- Optimize Operations
- Save Time
Enabling a Personalized and Digital Customer Experience (CX)
Find out how Gartner helped AARP achieve substantial CX improvement and contribute to $1.8 million in cost savings across the organization.

Increasing Revenue with a New Digital Strategy
Find out how Gartner helped Pennsylvania State Employees Credit Union (PSECU) investment from the board, transform its website and improve growth.

Elevated Customer Experience While Saving Time and Money
Find out how Gartner helped Consumers Energy Company evaluate their existing technology and adjust their marketing org structure to improve customer experience.