Explore the big ideas and trends shaping the future of IT. Connect with peers, gain exclusive insights from Gartner experts, and leave with actionable strategies you can implement immediately.
- Gartner client? Log in for personalized search results.
The Ultimate CIO Toolkit for Navigating 2026 Successfully
Equip yourself for success in 2026 with Gartner’s essential CIO toolkit. Explore expert videos, predictions, and actionable resources addressing the year’s biggest IT challenges, from AI readiness to strategic pivots. Start the year strong with insights and tools designed to help you lead with confidence.
2026 H1 CIO Report: The Top CIO Challenges
From anonymous surveying to one-on-one advisory sessions, Gartner continuously monitors what’s new and now for CIOs. Here’s what we’ve heard from them in 2026.
The Top 10 Strategic Technology Trends for 2026
Handpicked to spark innovation, build resilience, and earn trust in our AI-driven, hyperconnected world, these trends are your call to action. CIOs and technology leaders must seize them now—think boldly and act decisively.
Strategic Cost Optimization for CIOs in the Age of AI
Cost optimization is no longer a savings exercise — it’s a leadership challenge. Discover how CIOs turn cost optimization into a growth lever using proven Gartner insights, tools and benchmarks.
Accelerate Enterprise AI Value Realization at Scale
Discover how leading organizations are overcoming the AI value gap and accelerating enterprise-wide impact. In this essential guide, Gartner reveals why AI value realization is a critical challenge and provides actionable steps CIOs can take to achieve scalable, sustainable results.
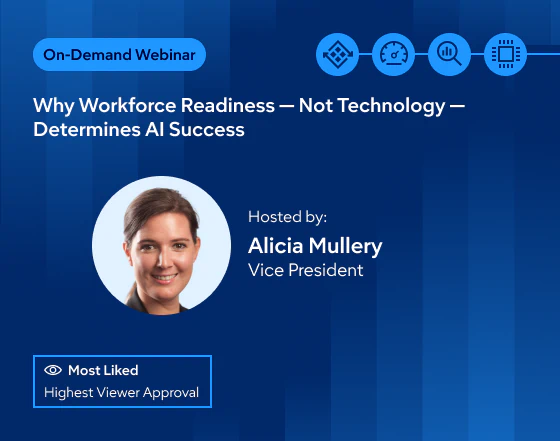
Human Readiness is the Key to Unlock AI Value
Discover why workforce readiness—not technology—is the key to AI success. In this highly rated Gartner webinar, learn the critical competencies, leadership strategies, and talent shifts needed to prepare your organization for AI-driven transformation.
Even more insights for IT leaders
Join a global community of CIOs and IT Executives
Attend a CIO Conference Near You
Client Success Stories
See how Gartner clients find value at IT Symposium/Xpo™
- AI Innovation
- Strategic Insights
- Industry Trends
- Achieving Business Objectives
Graphic Packaging’s Strategic Alignment Through AI Innovation
Seth Roach, Senior Director of Enterprise Solutions and Global Architecture at Graphic Packaging International, recognizes IT Symposium’s emphasis on AI, aligning with his own strategic priorities.

Enhancing Digital Transformation Through Strategic Research and Insights
Nathalie Angulo, COO of Global Bank, Panama, has attended IT Symposium four times and values the extensive networking opportunities and insights the conference provides to support her role.

Optimizing Municipal IT through Fusion Teams & Strategy Partnerships
Michael Farrar, CIO of Westerville, values IT Symposium’s collaborative atmosphere and future-focused sessions that inspire discussion and help advance with current industry trends.

How VITAS Leveraged Objective Insights to Transform VR Therapy in Healthcare
Patrick Hale, CIO of VITAS Healthcare, has attended IT Symposium for over 20 years. He values the unparalleled networking and relationship-building opportunities, connecting with fellow leaders who share his challenges and commitment to learning.

Gartner delivers actionable, objective insight to executives and their teams.
Have a question?
A real person is here for you.
“ Gartner has empowered us to stay ahead in the rapidly evolving landscape of Generative AI.”
CIO, The City of Westerville, OH